EconChick
Gold Member
- Feb 15, 2014
- 4,678
- 828
- 190
- Thread starter
- #961
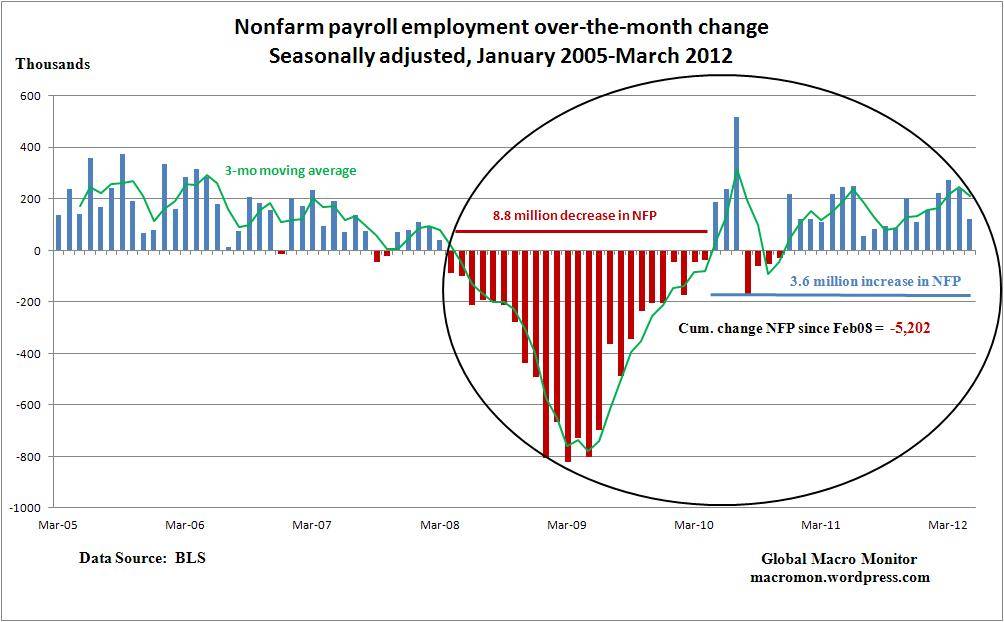
Good fricken gravy libtards. Do you know how easy it is for anyone to create a chart and claim they used BLS as their source??????????????????
I could start a company called ECONCHICK, make some graphs that say what I want them to say and then stick some little stamp at the bottom that implies I got the data from BLS.
All GRAPHS and charts are suspect, no matter what side of the political spectrum they came from. How many times do I have to say that on this board. You can't just slap charts and graphs without a discussion of the ASSUMPTIONS for starters ...and then explanation of all the other analysis.
This is why our economy is screwed up.....you libs can't analyze shit.
")