Navigation
Install the app
How to install the app on iOS
Follow along with the video below to see how to install our site as a web app on your home screen.

Note: This feature currently requires accessing the site using the built-in Safari browser.
More options
You are using an out of date browser. It may not display this or other websites correctly.
You should upgrade or use an alternative browser.
You should upgrade or use an alternative browser.
Let the Whistle Blowing Begin....
- Thread starter SSDD
- Start date
SSDD
Gold Member
- Nov 6, 2012
- 16,672
- 1,966
- 280
- Thread starter
- #62
So you're afraid to make your point? Got it.
Projecting again?....is that all you have?....Either you can identify the graphics as depictions of the basic mechanism of the greenhouse effect and thus put us on the same page to begin discussion...or you can't...easy as that.
SSDD
Gold Member
- Nov 6, 2012
- 16,672
- 1,966
- 280
- Thread starter
- #64
You're playing make-believe all by your pathetic little lonesome, dipshit.
Still afraid to identify those graphics as depicting the fundamental mechanism of the greenhouse effect...some climate crusader you are...milquetoast.....the word describes you to a T....
SSDD
Gold Member
- Nov 6, 2012
- 16,672
- 1,966
- 280
- Thread starter
- #66
You are a complete waste of time
Sorry crick...that describes you...I have questions and observations re: the greenhouse effect that I would like to discuss and you are afraid to even identify graphics from supposedly respected universities which purport to be depictions of the mechanism of the greenhouse effect....you are timid and afraid of getting bitch slapped....again...I get it...buzz off and maybe someone with more cojones than you will come along and be willing to discuss the topic...
SSDD
Gold Member
- Nov 6, 2012
- 16,672
- 1,966
- 280
- Thread starter
- #70
There's more knowledge in a perfect vacuum.
And still the fear to even verify that the graphics taken from the atmospheric sciences departments of supposedly respected schools is accurate...do you have any inkling of how big a looser that makes you?...what an ignoramus it shows you to be? You are scared of getting bitch slapped so you strut around displaying your fake...nervous bluster rather than being an adult and actually engaging the topic...
Old Rocks
Diamond Member
Rapidly declining sea ice in the Arctic is not observed data? The observed rapid warming in the Arctic region is not data? The melting of the Greenland ice cap is not observed data? The rapid melt of the alpine glaciers is not observed data?We claim that everything we see is natural variation.
"Natural variation" does not explain the stratospheric cooling, increase in backradiation, or the decrease in outgoing longwave in the GHG bands.
As your theory does not explain the observed data, it is wrong.
Global warming theory is the only theory that _does_ explain _all_ of the observed data, hence it is the accepted theory.
Thus we don't need to support ANYTHING.
Actually, you need a theory that isn't contradicted by the directly observed data. You don't have one. We do. Therefore, our theory is accepted. That's how science works. If you don't want to be laughed at, you need to come up with a theory that isn't contradicted by the observed data.
You have no observed data silly girl. That's the whole point. You take actual observations and "adjust" them to match your models. That's called scientific fraud.
Mr. Westwall, you continue to be a liar.
Old Rocks
Diamond Member
Note that SSDD is not giving links to the sites that those graphs came from. Because those sites use those graphs to explain the reality of AGW in a very simplified fashion. They are the notes for a 200 level course at the U of W. And that course and the article both state that AGW is real. SSDD is committing basic fraud claiming that the notes show the opposite. LOLIf one assumes equilibrium conditions. What's your point?
I am trying to ask a question....and can't even get that far because apparently you are going to equivocate over what is or isn't the greenhouse hypothesis....The University of Washington atmospheric sciences department says that the graph above describes the basic mechanism of the greenhouse effect....is that true or are they pushing falsehood?
The rest of these seem to be describing the same thing as the graph above....true or false?
this one from Penn State
This one just from the internet...slightly different numbers but seems to be describing the same mechanism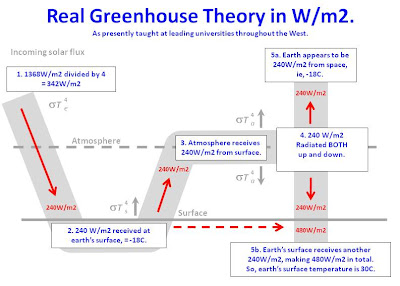
this one from Harvard...again...seems to be describing the same mechanism.
Do these describe the greenhouse effect as described by climate science or not?
Old Rocks
Diamond Member
Once again, SSDD, post the link and then the people here can see that the notes state those graphics show how AGW works. But you will not post the link that shows your dishonesty.There's more knowledge in a perfect vacuum.
And still the fear to even verify that the graphics taken from the atmospheric sciences departments of supposedly respected schools is accurate...do you have any inkling of how big a looser that makes you?...what an ignoramus it shows you to be? You are scared of getting bitch slapped so you strut around displaying your fake...nervous bluster rather than being an adult and actually engaging the topic...
SSDD
Gold Member
- Nov 6, 2012
- 16,672
- 1,966
- 280
- Thread starter
- #76
Note that SSDD is not giving links to the sites that those graphs came from. Because those sites use those graphs to explain the reality of AGW in a very simplified fashion. They are the notes for a 200 level course at the U of W. And that course and the article both state that AGW is real. SSDD is committing basic fraud claiming that the notes show the opposite. LOL
I gave links to each and every one on the thread devoted to this topic...of course you know that because you saw them...but just can't resist lying because a vulgar old lying whore is what you are and that's what you do.
Old Rocks
Diamond Member
Give you links on each post, or be regarded as someone afraid of the truth. For on that thread, I posted most of the text of those notes, which stated how untruthful your statements about them were.
SSDD
Gold Member
- Nov 6, 2012
- 16,672
- 1,966
- 280
- Thread starter
- #78
Give you links on each post, or be regarded as someone afraid of the truth. For on that thread, I posted most of the text of those notes, which stated how untruthful your statements about them were.
Do describe how I lied rocks...
In post # 1 I say “Again, I ask if these describe the basic mechanism of the greenhouse effect as described by climate science.” and went on to say “So are there any warmers here on the board that might be able to look at the graphics above and say whether or not they describe the basic mechanism of the greenhouse effect as described by climate science “
then in post #4 I say “if you are afraid to identify them as depictions of the basic mechanism of the greenhouse effect, I understand.”
then in post #8 I say “I am asking if those graphs, from the atmospheric sciences departments of respected universities depict the basic mechanism for the greenhouse effect....once I can establish that they are indeed depictions of the basic mechanism for the greenhouse effect, and that me and whoever cares to discuss my questions are beginning on the same page, then I would like to discuss the topic….”
in post #17 I say “And again...my question/observations were limited to the basic mechanism...if the data provided in those graphs is not depicting the basic mechanism, then it is good to know that the universities are promoting fake/useless info.”
in post #22 I say “All I am asking is if that graph depicts the basic mechanism of the greenhouse effect…”
In post #23 I say:”either we agree that the graphic in question depicts the basic mechanism for the greenhouse effect, or we don’t…"
in post #26 I say “I don't have a graduate level question...my questions/comments are pretty much restricted to the graphics and what they say...either the information is accurate at a basic level or it isn’t…”
in post #29 I say “ So since my questions/observations are basic in nature, can we proceed with the graphics above assuming that they depict the bare fundamentals and describe the most basic mechanism of the greenhouse effect”
in post #32 I say “My questions/observations go to the fundamentals...it is at the bare bones foundation that I want to start...either you can discuss the topic at that level...or you can't...I deliberately chose the most fundamental description of the greenhouse effect that I could find. Like I said...I don't want to get diverted by trivialities and tangents… “
And on it goes...over and over stating explicitly that my questions go to the bare bones fundamentals and that I am asking if the graphics are an accurate depiction of a stripped down model of the mechanism of the greenhouse effect...
How you get dishonesty out of that can only be attributed to your fundamental dishonesty...since you lie about everything, you can't help but assume that everyone else is always lying as well...you figure that since that is how you are...that must be how everyone else is as well.
Last edited:
Old Rocks
Diamond Member
Energy flux absorbed by the Earth = Radiation emitted by the Earth
239.7 W/m2 = constant x T4
To solve this equation, all we need to do is divide the emitted radiation (239.7 watts per square meter) by the constant (5.67 x 10⁻⁸) and take the fourth root of the result. Dividing we obtain 42.3 x 10⁻⁸. We'll take the fourth root on a calculator, but to check it's a good idea to estimate the result by taking the square root of 50, which should be just about 7 and taking the square root of 7 which should be around 2.5. The fourth root of 10 to the eighth power is 100. Hence, the answer should be a number around 2.5 x 100 or 250. The calculated result is 255. Remember that all results obtained from the Stefan_Boltzmann Law and other radiation laws are expressed in degrees Kelvin, so this is 255 K (-18 °C, 0 °F):
T = 255 K
The figure below illustrates how we derived this energy balance.

This effective temperature of 255 K is the temperature the Earth's Surface would have if it didn't have an atmosphere. It would be awfully cold! In reality, the Earth's surface temperature is closer to 288 K (15 °C, 59 °F). This difference of 33 K is the magnitude of the greenhouse effect. Before we go into more details about what this greenhouse effect is, let's look at Venus and Mars, our closest neighbours and calculate their effective temperatures.
ATM S 211 - Notes
Anyone interested can go to the site at the link.
edthecynic
Censored for Cynicism
- Oct 20, 2008
- 43,044
- 6,883
- 1,830
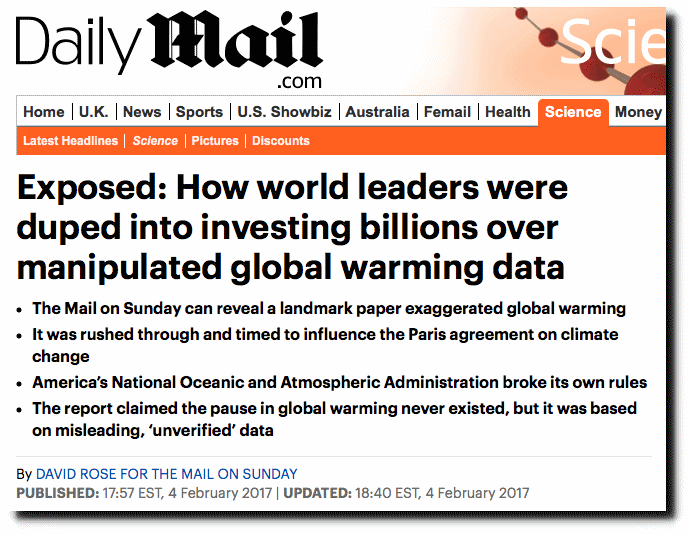
The only people duped by the fake graph in the Mail article were you gullible deniers.

Similar threads
- Replies
- 5
- Views
- 86
- Replies
- 115
- Views
- 3K
Latest Discussions
- Replies
- 138
- Views
- 581
- Replies
- 8
- Views
- 45
- Replies
- 148
- Views
- 635
- Replies
- 179
- Views
- 852
Forum List
-
-
-
-
-
Political Satire 8250
-
-
-
-
-
-
-
-
-
-
-
-
-
-
-
-
-
-
-
ObamaCare 781
-
-
-
-
-
-
-
-
-
-
-
Member Usernotes 476
-
-
-
-
-
-
-
-
-
-