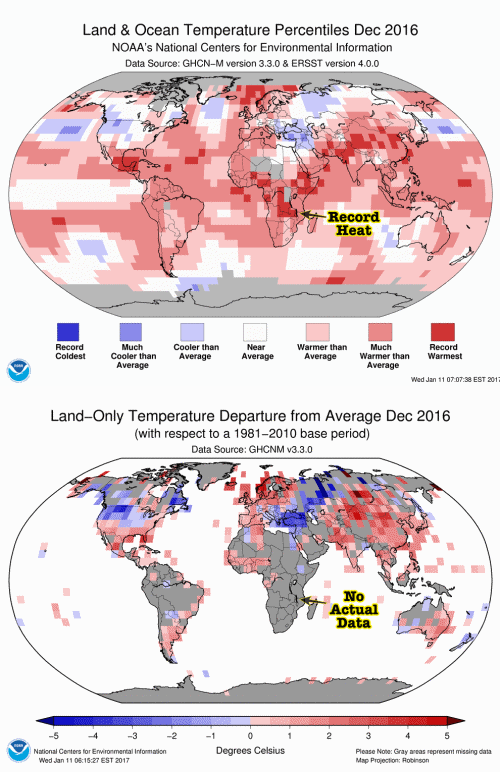
NOAA/NASA temperature data ALL FAKE!!!

The orange clown will be too busy fighting Constitutional lawsuits over his silly EO's to bother with lying about climate science, also. LOL

He'll leave that all to the lawyers. He's got an agenda to implement.

Greg
 
Nah......what hoax?

Check the link.........imaginary data.:eusa_dance::eusa_dance::eusa_dance:
NASA / NOAA Climate Data Is Fake Data | The Deplorable Climate Science Blog
You alarmist bozo's are such a bunch of suckers!!!:funnyface::funnyface::funnyface::funnyface::fu:
585856461c00000a070ec769.jpeg
 
lol.....look at the intellectual responses from the progressives on this news.

Not that it matters......:bye1::bye1:........none of them can post up one single link displaying for the rest of us where the science is mattering outside the realm of the internet forums and universities. Its standing on its own like a giant cribbage club. Congress has been snoozing on this shit since 2007 which means the "consensus" is having zero effect on energy policy as renewable energy is still decidedly fringe. Too....the whole climate industry has been getting kicked in the PR nut sack for years with wholesales reports of impropriety with the data rigging.

The losing is epic and these fools know it too.....the scam has been exposed.:coffee:
 
Nah......what hoax?

Check the link.........imaginary data.:eusa_dance::eusa_dance::eusa_dance:
https://realclimatescience.com/2017/02/nasa-noaa-climate-data-is-fake-data/
You alarmist bozo's are such a bunch of suckers!!!:funnyface::funnyface::funnyface::funnyface::fu:
Actually the SUCKERS are those stupid enough to swallow the lies on your link!
A perfect example of how everything that comes from the deniers is a lie is your link's blink map.

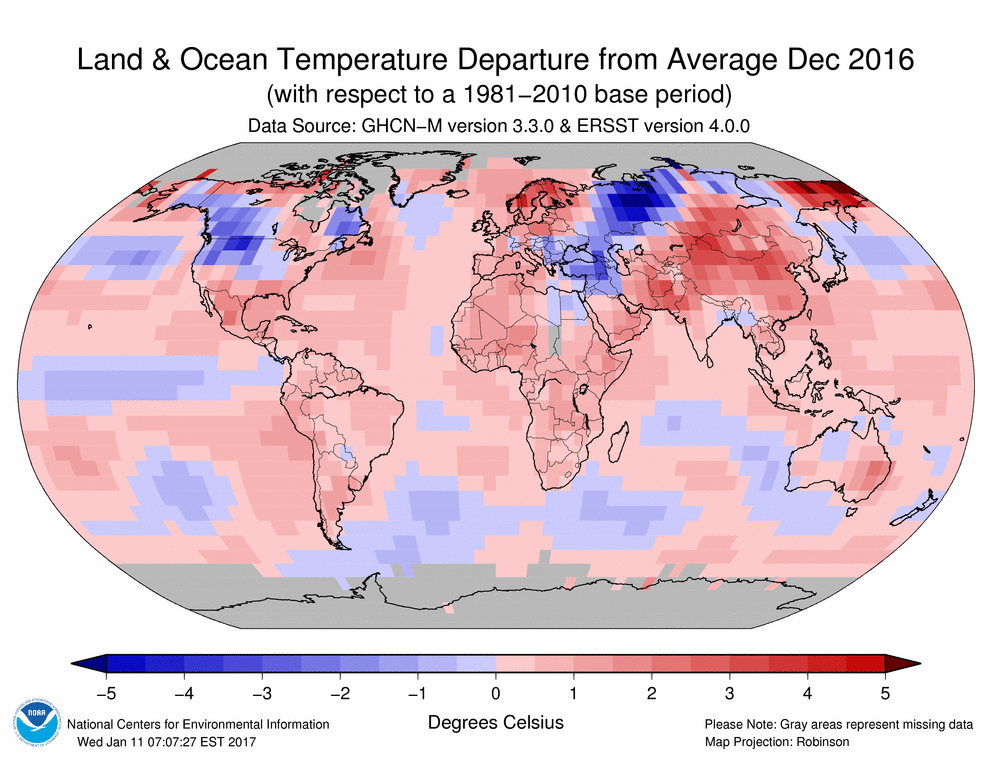
If you pay attention the two blinks are of two different things. One is a map of land temperature ANOMALIES and the other is temperature PERCENTILES!!!!!!!!!
122016.gif


Here is the actual ANOMALY map:
201612.gif


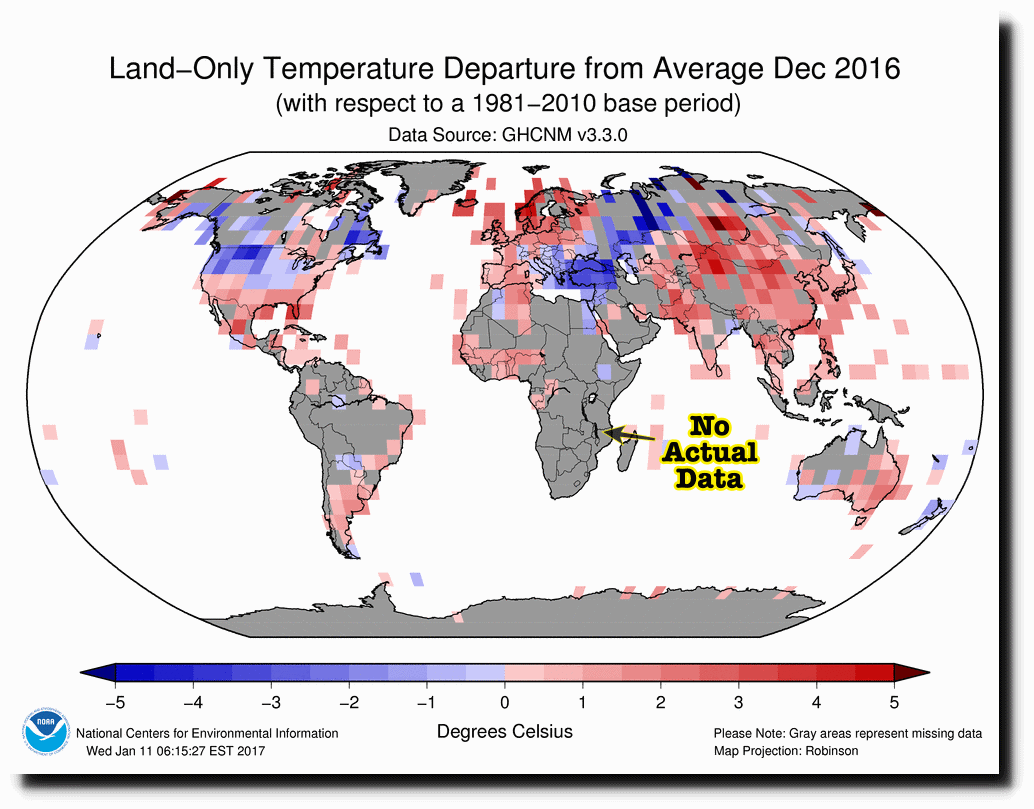
lol.......ones a "land only" and one is a "land and ocean". You fucking dummy!!:eusa_dance::eusa_dance::funnyface:

Even funnier?

Look at the "anomaly" colors!! They represent about 0.07 of a degree!!:deal::lmao::lmao::lmao:These people want us to go back to wood burning stoves and candlelight over a tenth of a degree!!
 
Last edited:
God....I love this forum. In life, I walk around and hope I bump into a progressive saying something profoundly retarded. Here, the stoopid gets put on a tee for me.............daily!:popcorn:
 
Nah......what hoax?

Check the link.........imaginary data.:eusa_dance::eusa_dance::eusa_dance:
https://realclimatescience.com/2017/02/nasa-noaa-climate-data-is-fake-data/
You alarmist bozo's are such a bunch of suckers!!!:funnyface::funnyface::funnyface::funnyface::fu:
Actually the SUCKERS are those stupid enough to swallow the lies on your link!
A perfect example of how everything that comes from the deniers is a lie is your link's blink map.

If you pay attention the two blinks are of two different things. One is a map of land temperature ANOMALIES and the other is temperature PERCENTILES!!!!!!!!!
122016.gif


Here is the actual ANOMALY map:
201612.gif


lol.......ones a "land only" and one is a "land and ocean". You fucking dummy!!:eusa_dance::eusa_dance::funnyface:

Even funnier?

Look at the "anomaly" colors!! They represent about 0.07 of a degree!!:deal::lmao::lmao::lmao:These people want us to go back to wood burning stoves and candlelight over a tenth of a degree!!
Exaggeration and lying is the name of their game.. When the empirical observations call them out a liars they tweak their models and hope none exposes their fantasy lies.

Doing the same failed behavior over and over again expecting a different result.. Sounds like the definition of insanity, don't it? :dig:
 
Nah......what hoax?

Check the link.........imaginary data.:eusa_dance::eusa_dance::eusa_dance:
https://realclimatescience.com/2017/02/nasa-noaa-climate-data-is-fake-data/
You alarmist bozo's are such a bunch of suckers!!!:funnyface::funnyface::funnyface::funnyface::fu:
Actually the SUCKERS are those stupid enough to swallow the lies on your link!
A perfect example of how everything that comes from the deniers is a lie is your link's blink map.

If you pay attention the two blinks are of two different things. One is a map of land temperature ANOMALIES and the other is temperature PERCENTILES!!!!!!!!!
122016.gif


Here is the actual ANOMALY map:
201612.gif
In-filling of data to create the illusion of warming.. Yep we know all about how they are tweaking the modeling.. Now so does the world by the staff who have been forced to act unethically for their masters in the cult. Now they are clearing their consciousness's
 
Nah......what hoax?

Check the link.........imaginary data.:eusa_dance::eusa_dance::eusa_dance:
https://realclimatescience.com/2017/02/nasa-noaa-climate-data-is-fake-data/
You alarmist bozo's are such a bunch of suckers!!!:funnyface::funnyface::funnyface::funnyface::fu:
Actually the SUCKERS are those stupid enough to swallow the lies on your link!
A perfect example of how everything that comes from the deniers is a lie is your link's blink map.

If you pay attention the two blinks are of two different things. One is a map of land temperature ANOMALIES and the other is temperature PERCENTILES!!!!!!!!!
122016.gif


Here is the actual ANOMALY map:
201612.gif


lol.......ones a "land only" and one is a "land and ocean". You fucking dummy!!:eusa_dance::eusa_dance::funnyface:
The PERCENTILE map your liars used in place of the anomaly map WAS land & ocean :asshole:
 
In-filling of data to create the illusion of warming..
Or deniers lying about no data stations in Central Africa!

From the OP's link
201612-land-4.gif

Actual data stations in Africa:
ndp041.temp.gif

An awful lot of data station red dots in the grey no data stations areas of the denier's phony map of data stations.
 
all fake ed...and the cows are coming home to roost....tell me, how far must climate science fall before you give up your first class seat on the crazy train?
 
all fake ed...and the cows are coming home to roost....tell me, how far must climate science fall before you give up your first class seat on the crazy train?
So it doesn't matter to you that the OP's source was lying about there being NO data stations in Central Africa, and yet you think I'm on the Tramp crazy train. :cuckoo:

From the OP's link:
"NOAA has almost no temperature data from Africa, and none from central Africa. They simply made up the record temperatures."
ndp041.temp.gif
 

Forum List

Back
Top