Latest oceanic heat content shows warming of our oceans!

my point is the earth compared to the sun simply doesn't matter in the heating of all but maybe a few hotspots on the bottom of the oceans. The top 2,000 meters is 99% warmed by the SUN Or the Green house effect readmitting the ir radiations back towards them.

Loserterians live on a planet that thinks totally opposite of me. Living out in the outback somewhere or some swamp that believes we don't need our science institutions. jeezzzzzzzzzzzz


The Sun does all the heating.

The atmosphere, with or without GHGs, affects the heat loss and therefore the equilibrium temperature.

Greenhouse gases absorb IR from the surface and warms the atmosphere.

All but the smallest sliver of energy comes from the Sun to heat both the surface and the atmosphere. There is no heating of the surface by the atmosphere, only changes in the pathway of energy loss.
 
Hey Matt, why haven't you gotten back to me on historical OHC? I would be interested in your take on the subject.
 
FCT, you missed radioactive decay.

Hot spots from "biomaterial decay"?

Bad news for you son, life doesn't create heat. The exothermic reactions involved in the decay of organic material can release no more energy than was absorbed directly and indirectly by the processes responsible for the growth of that material while it was alive. And, in the majority of instances, it is far, far less. Over the long run, a stable population of lifeforms is a zero sum game regarding heat. We take in food whose energy content originated from the sun. We release it in processes which produce power and growth. At the end, that growth decomposes and releases the energy it held in chemical potentia.

Well you almost got that right. What with your overall conservation of energy and mass and all...

But -- Just didn't account for JUST the conversions involved with heat.... Plants use visible light as power source.. If that visible light hits a rock -- it warms and pretty immediately gives the heat back as IR and convective heat..

Visible light by itself is not heat unless it's absorbed.. Can't be absorbed as mere heat and used to power photosynthesis at the same time.. So plants don't store heat.. Never really took "heat" out of the living exchange..
((somewhat weak and ponderable since they do change albedo and provide shade at the surface.))
And the heat of decomposition in a bog or swamp or the bottom of a rain forest is extremely significant..

I don't know.... :dunno: Just congratulations on having a thought. Assuming it wasn't Wiki'd...
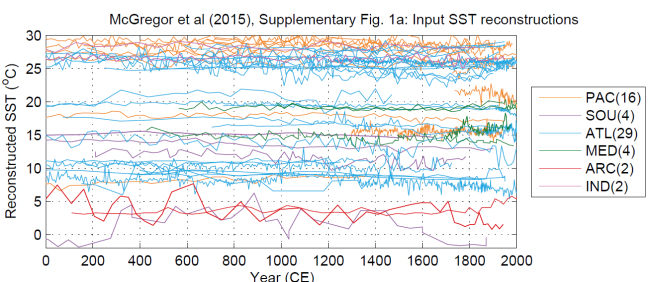
 
ocean2k_recon.png


figure_s1a.png


A couple of graphs from the new SST proxy reconstruction.
 
ocean2k_recon.png


figure_s1a.png


A couple of graphs from the new SST proxy reconstruction.

What's a SSurface "proxy" ??? And why should I care about top level water temps? It's just unmixed STORAGE of heat and not really a measure of atmos heating...

Seems to me to be equivalent to finding Global Warming by going around and taking the temperature of boulders and rocks...


Hahahahaha. The paper is paywalled. I don't have any more info than the SI. Apparently it has been sitting in the PAGES2K group for a few years and is now being released.

Another low (200 years) sensitivity proxy paper. But it does seem to confirm OHC was higher in the past. It will be interesting to see how they torture a hockey stick out of that data for the press release.
 
We don't have the data to prove it, all we know for certain is 2015 is the Warmest EVER!
 
We don't have the data to prove it, all we know for certain is 2015 is the Warmest EVER!


So they say. Apparently they want to make sure this year's announcement doesn't put egg on their face like last year. Crank up the thermostat Gavin!
 
nature.comhomepage
Nature Geoscience
Menu

ARTICLE PREVIEWview full access options

NATURE GEOSCIENCE | PROGRESS ARTICLE

Nature Geoscience

8,

671–677

(2015)
doi:10.1038/ngeo2510
Received

24 October 2014
Accepted

17 July 2015
Published online

17 August 2015
Citation
Abstract
The oceans mediate the response of global climate to natural and anthropogenic forcings. Yet for the past 2,000 years — a key interval for understanding the present and future climate response to these forcings — global sea surface temperature changes and the underlying driving mechanisms are poorly constrained. Here we present a global synthesis of sea surface temperatures for the Common Era (CE) derived from 57 individual marine reconstructions that meet strict quality control criteria. We observe a cooling trend from 1 to 1800 CE that is robust against explicit tests for potential biases in the reconstructions. Between 801 and 1800 CE, the surface cooling trend is qualitatively consistent with an independent synthesis of terrestrial temperature reconstructions, and with a sea surface temperature composite derived from an ensemble of climate model simulations using best estimates of past external radiative forcings. Climate simulations using single and cumulative forcings suggest that the ocean surface cooling trend from 801 to 1800 CE is not primarily a response to orbital forcing but arises from a high frequency of explosive volcanism. Our results show that repeated clusters of volcanic eruptions can induce a net negative radiative forcing that results in a centennial and global scale cooling trend via a decline in mixed-layer oceanic heat content.

READ THE FULL ARTICLE
  • Subscribe to Nature Geoscience for full access:$175
    Subscribe
  • Purchase article full text and PDF:$32
    Buy now
Already a subscriber? Log in now orRegister for online access.

Additional access options:
Abstract
  • References•
  1. Moberg, A., Sonechkin, D. M., Holmgren, K.,Datsenko, N. M. & Karlen, W. Highly variable Northern Hemisphere temperatures reconstructed from low- and high-resolution proxy data. Nature 433, 613–617 (2005).
  2. Mann, M. E. et al. Global signatures and dynamical origins of the Little Ice Age and Medieval Climate Anomaly. Science 326,1256–1260 (2009).
  3. Jones, P. D. et al. High-resolution palaeoclimatology of the last millennium: A review of current status and future prospects.Holocene 19, 3–49 (2009).
  4. Braconnot, P. et al. Evaluation of climate models using palaeoclimatic data. Nature Clim. Change2, 417–424 (2012).
  5. Marcott, S. A., Shakun, J. D., Clark, P. U. & Mix, A. C. A reconstruction of regional and global temperature for the past 11,300 years. Science339, 1198–1201 (2013).
  6. Schmidt, G. A. et al. Climate forcing reconstructions for use in PMIP simulations of the last millennium (v1.1). Geosci. Model Dev. 5,185–191 (2012).
  7. PAGES 2k Consortium Continental-scale temperature variability during the past two millennia. Nature Geosci. 6, 339–346 (2013).
  8. Gill, A. E. Atmosphere–Ocean Dynamics Vol. 30 (International Geophysics Series, Academic,1982).
  9. Balmaseda, M. A., Trenberth, K. E. & Källén, E.Distinctive climate signals in reanalysis of global ocean heat content. Geophys. Res. Lett.40, 1754–1759 (2013).
  10. Rhein, M. et al. in Climate Change 2013: The Physical Science Basis (eds Stocker, T. F. et al.)255–315 (IPCC, Cambridge Univ. Press, 2013).
  11. Kennedy, J. J. A review of uncertainty in in situmeasurements and data sets of sea surface temperature. Rev. Geophys. 52, 1–32 (2014).
  12. Lee, T. C. K., Zwiers, F. W. & Tsao, M. Evaluation of proxy-based millennial reconstruction methods. Clim. Dynam. 31, 263–281 (2008).
  13. Mann, M. E. et al. Proxy-based reconstructions of hemispheric and global surface temperature variations over the past two millennia. Proc. Natl Acad. Sci. USA 105, 13252–13257 (2008).
  14. Evans, M. N., Tolwinski-Ward, S. E., Thompson, D. M. & Anchukaitis, K. J. Applications of proxy system modeling in high resolution paleoclimatology. Quat. Sci. Rev. 76, 16–28(2013).
  15. Lohmann, G., Pfeiffer, M., Laepple, T., Leduc, G.& Kim, J. H. A model–data comparison of the Holocene global sea surface temperature evolution. Clim. Past 9, 1807–1839 (2013).
  16. Laepple, T. & Huybers, P. Global and regional variability in marine surface temperatures.Geophys. Res. Lett. 41, 2528–2534 (2014).
  17. Lamb, H. H. The early medieval warm epoch and its sequel. Palaeogeogr. Palaeoclimatol. Palaeoecol. 1, 13–37 (1965).
  18. Neukom, R. et al. Inter-hemispheric temperature variability over the past millennium. Nature Clim. Change 4, 362–367 (2014).
  19. Kaplan, A. et al. Analyses of global sea surface temperature 1856–1991. J. Geophys. Res.-Oceans 103, 18567–18589 (1998).
  20. Allan, R. et al. The international Atmospheric Circulation Reconstructions over the Earth (ACRE) initiative. Bull. Am. Meteorol. Soc. 92,1421–1425 (2011).
  21. Emile-Geay, J., Cobb, K. M., Mann, M. E. &Wittenberg, A. T. Estimating central equatorial Pacific SST variability over the past millennium. Part I: Methodology and validation. J. Climate26, 2302–2328 (2013).
  22. Tierney, J. E. et al. Tropical sea-surface temperatures for the past four centuries reconstructed from coral archives.Paleoceanography 30, 226–252 (2015).
  23. Evans, M. N., Kaplan, A. & Cane, M. A. Pacific sea surface temperature field reconstruction from coral δ18O data using reduced space objective analysis. Paleoceanography 17, 1007(2002).
  24. Masson-Delmotte, V. et al. in Climate Change 2013: The Physical Science Basis (eds Stocker, T. F. et al.) 409–415 (IPCC, Cambridge Univ. Press, 2013).
  25. McKay, N. P. & Kaufman, D. S. An extended Arctic proxy temperature database for the past 2,000 years. Sci. Data 1, 140026 (2014).
  26. Phipps, S. J. et al. Paleoclimate data–model comparison and the role of climate forcings over the past 1500 years. J. Climate 26,6915–6936 (2013).
  27. Crespin, E., Goosse, H., Fichefet, T., Mairesse, A.& Sallaz-Damaz, Y. Arctic climate over the past millennium: Annual and seasonal responses to external forcings. Holocene 23, 321–329 (2013).
  28. Delaygue, G. & Bard, E. An Antarctic view of Beryllium-10 and solar activity for the past millennium. Clim. Dynam. 36, 2201–2218(2011).
  29. Schurer, A. P., Tett, S. F. B. & Hegerl, G. C. Small influence of solar variability on climate over the past millennium. Nature Geosci. 7, 104–108(2014).
  30. Bard, E. & Frank, M. Climate change and solar variability: What's new under the sun? Earth Planet. Sci. Lett. 248, 1–14 (2006).
  31. Rind, D., Lean, J., Lerner, J., Lonergan, P. &Leboissitier, A. Exploring the stratospheric/tropospheric response to solar forcing. J. Geophys. Res.-Atmos. 113, D24103(2008).
  32. Berger, A. L. Long-term variations of daily insolation and Quaternary climatic changes. J. Atmos. Sci. 35, 2362–2367 (1978).
    2.0.CO;2&rft_id=info:pmid/{pubmed}&rft_val_fmt=info:eek:fi/fmt:kev:mtx:journal&rft.genre=article&rft.aulast=Berger&rft.aufirst=A. L.&rft.jtitle=J. Atmos. Sci.&rft.volume=35&rft.spage=2362&rft.epage=2367&rft.date=1978&rft.atitle=Long-term variations of daily insolation and Quaternary climatic changes&rfr_id=info:sid/nature.com:Nature.com&id=doi:10.1175/1520-0469(1978)035<2362>2.0.CO;2&id=pmid:{pubmed}&genre=article&aulast=Berger&aufirst=A. L.&title=J. Atmos. Sci.&volume=35&spage=2362&epage=2367&date=1978&atitle=Long-term variations of daily insolation and Quaternary climatic changes&sid=nature:Nature">
  33. Hays, J. D., Imbrie, J. & Shackleton, N. J.Variations in the Earth's orbit: Pacemaker of the Ice Ages. Science 194, 1121–1132 (1976).
  34. Esper, J. et al. Orbital forcing of tree-ring data.Nature Clim. Change 2, 862–866 (2012).
  35. Kaufman, D. S. et al. Recent warming reverses long-term Arctic cooling. Science 325,1236–1239 (2009).
  36. Brovkin, V. et al. Biogeophysical effects of historical land cover changes simulated by six Earth system models of intermediate complexity. Clim. Dynam. 26, 587–600 (2006).
  37. Goosse, H. et al. The origin of the European “Medieval Warm Period”. Clim. Past 2, 99–113(2006).
  38. de Noblet-Ducoudré, N. et al. Determining robust impacts of land-use-induced land cover changes on surface climate over North America and Eurasia: Results from the first set of LUCID experiments. J. Climate 25, 3261–3281 (2012).
  39. He, F. et al. Simulating global and local surface temperature changes due to Holocene anthropogenic land cover change. Geophys. Res. Lett. 41, 623–631 (2014).
  40. Hansen, J., Lacis, A., Ruedy, R. & Sato, M.Potential climate impact of Mount Pinatubo eruption. Geophys. Res. Lett. 19, 215–218(1992).
  41. Robock, A. Volcanic eruptions and climate. Rev. Geophys. 38, 191–219 (2000).
  42. Stenchikov, G. et al. Volcanic signals in oceans.J. Geophys. Res.-Atmos. 114, D16104 (2009).
  43. Miller, G. H. et al. Abrupt onset of the Little Ice Age triggered by volcanism and sustained by sea-ice/ocean feedbacks. Geophys. Res. Lett.39, L02708 (2012).
  44. Plummer, C. T. et al. An independently dated 2000-yr volcanic record from Law Dome, East Antarctica, including a new perspective on the dating of the 1450s CE eruption of Kuwae, Vanuatu. Clim. Past 8, 1929–1940 (2012).
  45. Sigl, M. et al. Insights from Antarctica on volcanic forcing during the Common Era. Nature Clim. Change 4, 693–697 (2014).
  46. Goosse, H., Barriat, P. Y., Lefebvre, W., Loutre, M. F. & Zunz, V. Introduction to Climate Dynamics and Climate Modeling (Université catholique de Louvain, 2015); Introduction to climate dynamics and climate modelling - Welcome Page
  47. Crowley, T. J. Causes of climate change over the past 1000 years. Science 289, 270–277(2000).
  48. Zhong, Y. et al. Centennial-scale climate change from decadally-paced explosive volcanism: A coupled sea ice-ocean mechanism. Clim. Dynam. 37, 2373–2387 (2011).
  49. Mignot, J., Khodri, M., Frankignoul, C. &Servonnat, J. Volcanic impact on the Atlantic Ocean over the last millennium. Clim. Past 7,1439–1455 (2011).
  50. Ding, Y. et al. Ocean response to volcanic eruptions in Coupled Model Intercomparison Project 5 simulations. J. Geophys. Res.-Oceans119, 5622–5637 (2014).
Download references

[paste:font size="6"]Abstract

  • Author information•
[paste:font size="5"]Affiliations
  1. School of Earth and Environmental Sciences, Northfields Avenue, University of Wollongong, New South Wales 2522, Australia
    • Helen V. McGregor
  2. Department of Geology and Earth System Science Interdisciplinary Center, University of Maryland, College Park, Maryland 20742, USA
    • Michael N. Evans
  3. Earth and Life Institute, Université de Louvain, Place Pasteur 3, 1348 Louvain-la-Neuve, Belgium
    • Hugues Goosse
  4. Aix Marseille Université, CNRS, IRD, CEREGE UM34, 13545 Aix-en-Provence Cedex 4, France
    • Guillaume Leduc
  5. Department of Environmental Chemistry, Institute of Environmental Assessment and Water Research (IDÆA), Spanish Council for Scientific Research (CSIC), 08034 Barcelona, Spain
    • Belen Martrat
  6. Department of Earth Sciences, University of Cambridge, Downing Street, Cambridge CB2 3EQ, UK
    • Belen Martrat
  7. U.S. Geological Survey, 345 Middlefield Road, MS 910, Menlo Park, California 94025, USA
    • Jason A. Addison
  8. Institute of Environmental Science and Technology (ICTA) and Department of Geography, Universitat Autonoma de Barcelona, Bellaterra 08193, Spain
    • P. Graham Mortyn
  9. Department of Geology and Geophysics, Woods Hole Oceanographic Institution, Woods Hole, Massachusetts 02543, USA
    • Delia W. Oppo
  10. Centre for Past Climate Studies and Arctic Research Centre, Department of Geoscience, Aarhus University, Hoegh-Guldbergs Gade 2, DK-8000 Aarhus C, Denmark
    • Marit-Solveig Seidenkrantz
  11. Sorbonne Universités (UPMC, Univ. Paris 06)-CNRS-IRD-MNHN, LOCEAN Laboratory, 4 Place Jussieu, F-75005 Paris, France
    • Marie-Alexandrine Sicre
  12. ARC Centre of Excellence for Climate System Science, University of New South Wales, Sydney, New South Wales 2052, Australia
    • Steven J. Phipps
  13. Climate Change Research Centre, University of New South Wales, Sydney, New South Wales 2052, Australia
    • Steven J. Phipps
  14. State Key Laboratory of Marine Environmental Science, Xiamen University, Xiamen 361102, China
    • Kandasamy Selvaraj
  15. Institute for Geophysics, Jackson School of Geosciences, University of Texas at Austin, J. J. Pickle Research Campus, Building 196, 10100 Burnet Road (R2200), Austin, Texas 78758-4445, USA
    • Kaustubh Thirumalai
  16. Department of Geology, Lund University, Sölvegatan 12, SE-223 62 Lund, Sweden
    • Helena L. Filipsson
  17. Department of Geography, Northumbria University, Newcastle upon Tyne NE1 8ST, UK
    • Vasile Ersek
Contributions
M.N.E., H.V.M., D.W.O., H.G., G.L. and B.M. designed the project with input from J.A.A., M.-S.S., M.-A.S., K.S. and V.E.; H.V.M. and G.L. led the synthesis. H.V.M. and B.M. collated and evaluated the reconstructions, and managed the data with assistance from J.A.A.; M.N.E. led the analysis with important contributions from H.G., J.A.A., B.M., G.L., S.J.P., H.V.M., D.W.O., P.G.M., M.-S.S. and M.-A.S.; H.G. and S.J.P. collated, managed and analysed the model simulations with input from M.N.E., G.L. and H.V.M.; H.V.M. led the writing with the assistance of M.N.E., H.G., G.L., B.M., J.A.A., P.G.M., D.W.O., M.-S.S., M.-A.S., S.J.P., K.S., K.T., H.L.F and V.E.; all authors reviewed the manuscript.

Competing financial interests
The authors declare no competing financial interests.

Corresponding author
Correspondence to:

Abstract
  • Supplementary information
[paste:font size="5"]PDF files
  1. Supplementary Information (8,716 KB)
    Supplementary information

Additional data

Editors' pick

Professorship (W2) for Applied Geophysics
  • Friedrich Schiller University Jena
Substantial glacier mass loss in the Tien Shan over the past 50 years
Nature Geoscience 17 Aug 2015

[paste:font size="4"]This journal is printed on recycled paper

© 2015 Macmillan Publishers Limited. All Rights Reserved.partner of AGORA, HINARI, OARE, INASP, ORCID, CrossRef and COUNTER


Anyone got access to the paper to find out what proxies were used? (To put into the climate model)
 
Probably could fetch it thru Vanderbilt. I can only give "fair use" unless you want to meet me downtown Nashville for some live country music and a few adult beverages with you paying..
 
Probably could fetch it thru Vanderbilt. I can only give "fair use" unless you want to meet me downtown Nashville for some live country music and a few adult beverages with you paying..


Sorry, won't be in Nashville. I was hoping to find out the type of proxies for you, lol.
 
here is a quote from one of the authors-
"Today, the Earth is warming about 20 times faster than it cooled during the past 1,800 years," said Michael Evans, second author of the study and an associate professor in the University of Maryland's Department of Geology and Earth System Science Interdisciplinary Center (ESSIC). "This study truly highlights the profound effects we are having on our climate today."

Read more at: http://phys.org/news/2015-08-years-global-ocean-cooling-halted.html#jCp

here is the graph-
frequentvolc.png


20x faster??? am I missing something?

is he just claiming a hockeystick without actually publishing it? hahahahaha
 
Why do you laugh? Can you dispute his data? It seems not. And do YOU actually believe that if you can call something a hockey stick it's refutation is complete? The world's climate science work is filled with hockey sticks because that's what temperatures have done. You are certainly one of the best educated deniers on this board. If you think hockey sticks have been refuted, I see no hope for your cause. You would all be idiots then.
 
Why do you laugh? Can you dispute his data? It seems not. And do YOU actually believe that if you can call something a hockey stick it's refutation is complete? The world's climate science work is filled with hockey sticks because that's what temperatures have done. You are certainly one of the best educated deniers on this board. If you think hockey sticks have been refuted, I see no hope for your cause. You would all be idiots then.


I am actually quite impressed by interactive presentation of the proxy data. And how they plotted out all the individual proxies on one graph to give a general idea the shape of the data that they were working with.

But the data doesn't produce a hockey stick . and like so many before him, Evans gave a press release with claims that are not supported by the evidence provided.

The data had already been collected by the AR5 deadline. If it had been the right shape it would have been included. But it wasn't, so it languished for four years. Finally published, it gets little publicity and one of the few press releases is a fabricated conclusion unsupported by the actual work. Par for the course in climate science.


Remember Marcott13 and all the giddy interviews that basically only talked about the one part of the reconstruction that had to be disavowed as 'not robust'? Evans still gets to make the alarmist claims but no pesky paper trail for the skeptics to unravel. Brilliant really. As long as you leave your integrity and honesty outside the door.
 
Why do you laugh? Can you dispute his data? It seems not. And do YOU actually believe that if you can call something a hockey stick it's refutation is complete? The world's climate science work is filled with hockey sticks because that's what temperatures have done. You are certainly one of the best educated deniers on this board. If you think hockey sticks have been refuted, I see no hope for your cause. You would all be idiots then.

We LAUGH because these proxy methods are NOT thermometers. And they don't have the RESOLUTION in time to make sweeping generalizations about the rate of warming. So the data DOES NOT support the conclusion.. But
But But --- it's not actually a lie because the data -- which is VOID of any 100 or even 400 yr resolution -- and COULD NOT FIND a little spike like ours has 1000 yr rates and thermometers have 2 minute rates of measurement. So those claims are the grease that gets this work FUNDED and accepted at peer review..

It's grease.. not a lie.....
 
The rate of warming over the past one hundred years or so is not the product of proxies. The forcing required to create higher warming or cooling rates has not existed since the KT boundary event. The idea you and yours have repeated here, that extraordinary climatic events take place at random with no discernible cause, is horse shit.
 
The rate of warming over the past one hundred years or so is not the product of proxies. The forcing required to create higher warming or cooling rates has not existed since the KT boundary event. The idea you and yours have repeated here, that extraordinary climatic events take place at random with no discernible cause, is horse shit.

That's a bold view of climate NON-variability. Just like they WANT to believe by showing those historical studies with no variation in them.. BUT ----------------------

You're gonna lose on this idea that idyllic climate had no natural variability in it for thousands of years at a time.

Do some work and compare the relatively barren (because the data has no great time resolution) famous Vostok chart to the HI RES ice studies done in Greenland. Narrower slice of time -- more samples. Less filtering.

It shows MULTIPLE wild swings of temperature (> 6 or 8degF) coming out of the last Ice Age that are nowhere in the Vostok record... So hold the horse shit and learn a bit about data preparation.
 
I didn't say it had no variability. I said it has had no variability at the rates we've created over the last century with our GHG emissions.
 
Crayon scribbles on walls excite the strangest people. Scrawl a scribble on the wall with chicken scratch and you could convince the dumbest demographic that the sky is falling.
 

Forum List

Back
Top