Rshermr
VIP Member
Well, Toddster, lets look at your statements:Well, eflat, another stupid tea bagger to be educated. You could at least post something that had some real meaning. but this is embarrassing, eflat..That 30 year period after Reagan's tax cuts...no growth there
After JFK's tax cuts...economic decline???
My goodness this one is ignorant!
Reagan: Speaking of ignorant, were you aware that within 12 months after the great reagan tax decrease, unemployment had gone upward from 7% to over 10.5%? Bet your educators forgot to fill you in on this one.
And did they also fail to tell you, that in response to unemployment and the spiraling national debt that resulted from his great tax decrease, Reagan increased taxes 11 times?
And, did they also fail to mention that the great tax decrease caused Reagan to borrow more money than all of the presidents up till his time COMBINED? He tripled the national debt.
So, eflat, it appears to me that calling someone other than yourself ignorant is really a stupid thing to do.
JFK? JFK decreased taxes in GOOD economic times. That has been done before. It was not to provide an economic stimulus. By the way, eflat, I am NOT against tax decreases. I just happen to not be among those ignorant souls who are ignorant enough to believe that a tax decrease to the wealthy is a stimulus of any kind.
Reagan: Speaking of ignorant, were you aware that within 12 months after the great reagan tax decrease, unemployment had gone upward from 7% to over 10.5%?
What happened to interest rates over that 12 months?
What happened to unemployment 24 months later? 36? 48?
And, did they also fail to mention that the great tax decrease caused Reagan to borrow more money
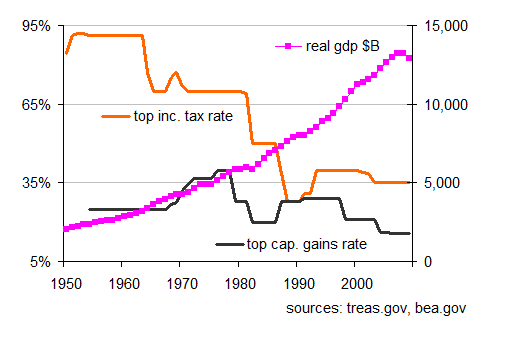
Really? Tax receipts decreased? I'm pretty sure income tax receipts went from $286 billion in 1981 to $445 billion in 1989. While the top rate went from 70% to 28%.

What happened to interest rates over that 12 months?
What happened to unemployment 24 months later? 36? 48?
Interest rates were one of the great advantages that reagan had. They were very high, set that way to fight inflation by the Fed. When the economy changed to less inflationary, the Fed took the rates downward to more normal rates.
Relative to unemployment, rates began to fall AFTER reagan began to borrow like crazy and spend like a drunk sailor. Remember, the national debt tripled during his presidency, and he spent it on STIMULATIVE projects. And, of course, he increased taxes several times (11 during his terms, to be exact) again decreasing unemployment. That is your problem, you do not follow the timeline of what happened. Simply taking a starting point and then moving forward to some point at which things were better, is totally lacking in integrity. You could go forward to 1999, and take in the 92 through 99 economies, giving reagan credit for that also if you really want to be disingenuous.
Really? Tax receipts decreased? I'm pretty sure income tax receipts went from $286 billion in 1981 to $445 billion in 1989. While the top rate went from 70% to 28%.
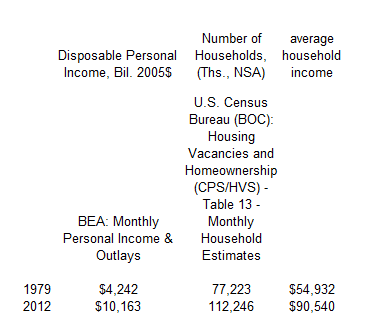
Revenue grew for a number of reasons. See above, in my first part of this post. But also because of population growth and inflation. From 1979 to 1991, revenue per capita grew only 1,8%. Pretty poor. But more importantly, I was talking about the period 1981 through 1983, when receipts fell. Again, it is very easy to lie with numbers if you pick your dates and data carefully. But I was only talking about what made reagans people determine that he needed to borrow and spend, and increase taxes and spend.
Again, a little honesty is valuable.
So, here is a question for you. Why, if the tax decreases were as successful as you seem to think, did he borrow to the point that he had tripled the national debt by the end of his term???
And why did he raise taxes 11 times, effectively negating about half of his original large tax decrease???