How those record temperatures were derived

http://www.ldeo.columbia.edu/~peter/Resources/Seminar/readings/Huang_boreholeTemp_Nature'00.pdf

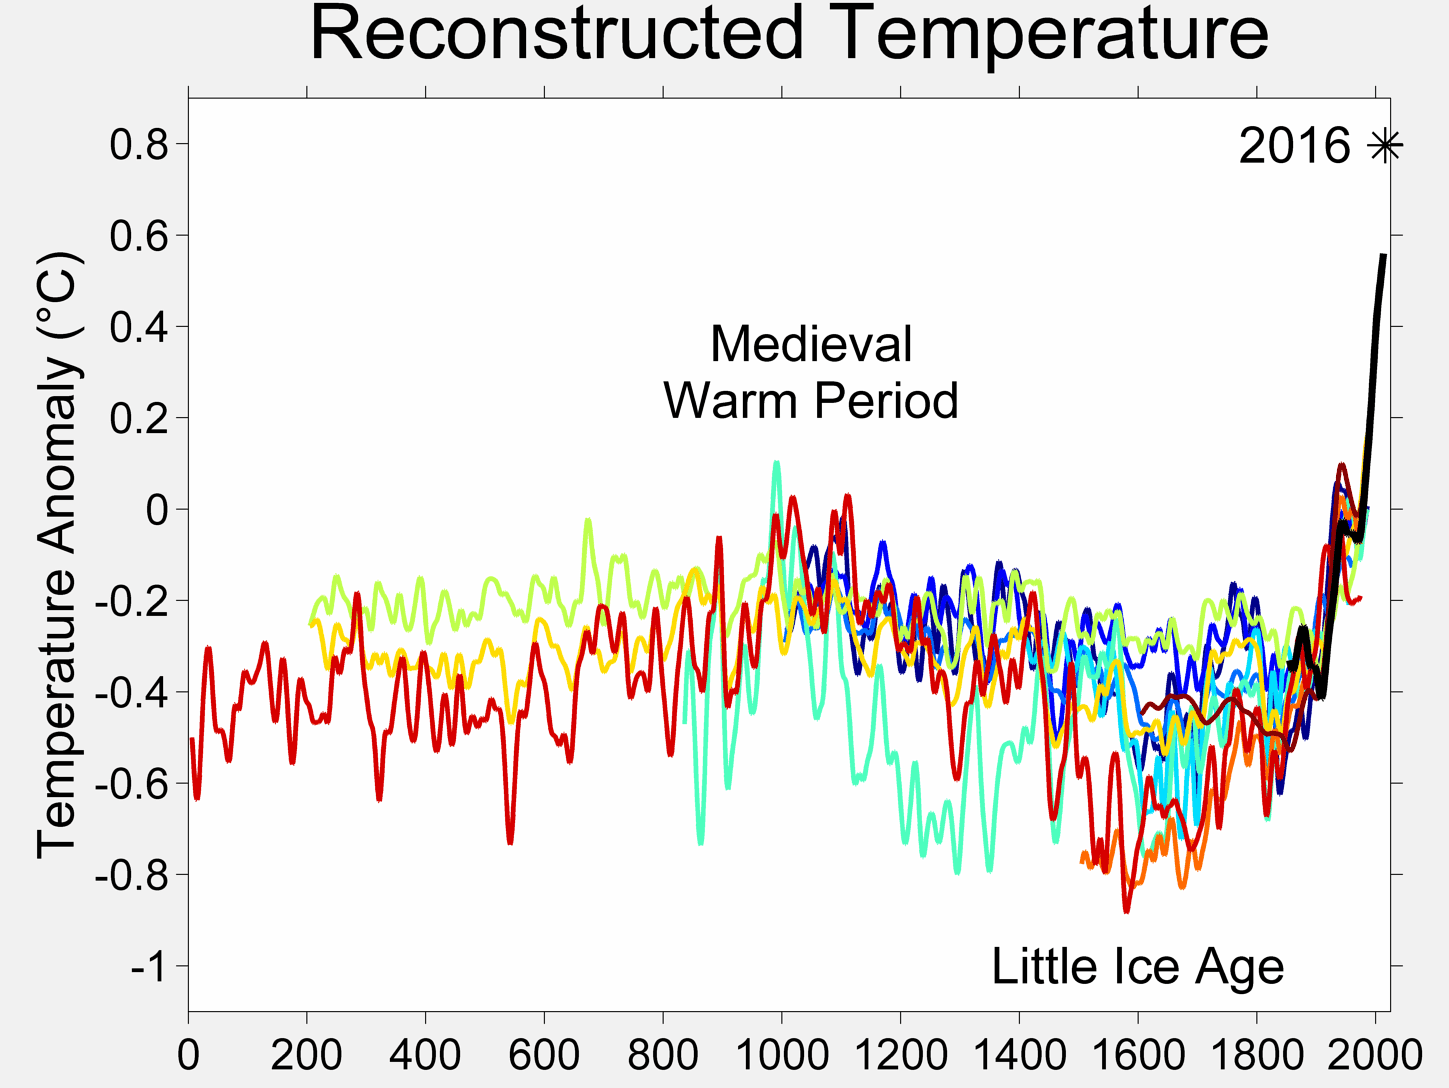
Huang 2000. Mann has his tree rings and Huang has his boreholes.

In Figure 3 in the report, the boreholes show a steady rise in temperature over the past 500 years, also fully 25% of the boreholes did not show any "net warming over the past five centuries"

OK? About 1 in 4 of the boreholes did not show a rise using the Warmers own methodology and the warming has been occurring since 300 years before the start of the Industrial Age.
Don't you deniers realize when you say crap like that you completely discredit yourself? :cuckoo:

Not only does the chart not show a "STEADY RISE" the text in your link says outright, "Almost 80% of the net temperature increase observed has occurred in the nineteenth and twentieth centuries." The chart is nearly flat until the 1700s, the beginning of the Industrial Revolution, and then it rises sharply after the Industrial Revolution to the present. Your post shows how deniers see only what they want to see and therefore no amount of data will ever get them to see the truth.

78% of the global boreholes showed warming, but to a denier that doesn't mean that 78% of the globe was warming, it apparently means the globe overall was not warming. :cuckoo:
And 20% of the warming coming before the I R and 80% coming after the I R tells a denier that the I R had nothing to do with the warming. :cuckoo:

Figure 3 shows a steady rise on all continents since the 1500's. That is indisputable.
In typical CON$ervoFascist fashion, when caught lying CON$ just keep on lying. That's indisputable.
 
As you well know, none of the temps you cite were from direct instrument measurements, nor are they global. They come from PROXY data from very limited locations and cannot be HONESTLY equated to global direct instrument measurements.
But deniers are NEVER honest!


But, but, but, but Mann used the EXACT SAME TECHNIQUES TO DERIVE HIS HOCKEY STICK (only because he is such a poor statistician and because he was basing it all on a single tree it got kinda fucked up)(oh damn I said a bad word...well in Mann's case it is deserved, he is the moral equivalent of a ...oh damn I can't say it...it's just to bad a description...even though it is accurate) so once again Bozo, ya can't have it both ways now can you!
What a load of crap.

Can you make a hockey stick without tree rings?
In the field of paleoclimatology, there are a variety of independent methods to determine past temperature changes: tree rings, ice cores, lake sediments, boreholes, stalagmites, etc. What do these independent methods find?

Surface temperature changes send thermal waves underground, cooling or warming the subterranean rock. Boreholes can be used to measure these changes. In Huang 2000, underground temperature measurements were examined from over 350 bore holes in North America, Europe, Southern Africa and Australia. Borehole reconstructions aren't able to give annual or even decadal variation, yielding only century-scale trends. What they find is that the 20th century is the warmest of the past five centuries. This provides independent confirmation that the Earth is warming dramatically (the blue line is the instrumental record).

Hockey_Stick_borehole.gif

Figure 1: Global surface temperature change over the last five centuries from boreholes (thick red line). Shading represents uncertainty. Blue line is a five year running average of HadCRUT global surface air temperature (Huang 2000).

Stalagmites (or speleothems) are formed from groundwater within underground caverns. As they're annually banded, the thickness of the layers are used as climate proxies. Figure 2 shows a Northern Hemisphere temperature reconstruction from stalagmites. While the uncertainty band (grey area) is significant, the temperature in the latter 20th Century exceeds the maximum estimate over the past 500 years.

Hockey_Stick_Stalagmite.gif

Figure 2: Northern Hemisphere annual temperature reconstruction from speleothem reconstructions shown with 2 standard error (shaded area) (Smith 2006).

Oerlemans 2005 used historical records of glacier length as a proxy for temperature. As the number of monitored glaciers diminishes in the past, the uncertainty grows accordingly. Nevertheless, temperatures in recent decades exceed the uncertainty range over the past 400 years.

Hockey_Stick_glacier.gif

Figure 3: Global mean temperature calculated form glaciers. The red vertical lines indicate uncertainty.

Of course, these examples only go back as far as 500 years - this doesn't even cover the Medieval Warm Period. When you combine all the various proxies, including ice cores, coral, lake sediments, glaciers, boreholes & stalagmites, it's possible to reconstruct Northern Hemisphere temperatures without tree-ring proxies going back 1,300 years (Mann 2008). The result is that temperatures in recent decades exceed the maximum proxy estimate (including uncertainty) for the past 1,300 years. When you include tree-ring data, you find the same result for the past 1,700 years.

NH_Temp_Reconstruction.gif

Figure 4: Composite Northern Hemisphere land and land plus ocean temperature reconstructions and estimated 95% confidence intervals. Shown for comparison are published Northern Hemisphere reconstructions (Mann 2008).

Paleoclimatology draws upon a range of proxies and methodologies to calculate past temperatures. This allows independent confirmation of the basic hockey stick result: that the past few decades are the hottest in the past 1,300 years.


Yes it does and those very same methods are being used to confirm that the MWP was indeed global and much warmer than the temps today. But my point is still relevant. Mann used data from (following extensive research) a single tree to generate his hockey stick. Below is an article that touches very lightly on Manns failings (which are vast)

'Hockey stick' graph was exaggerated - Telegraph

This link to a German site goes into extensive detail about the MWP and how prosperous it was. It has links to other books and articles that corroborate the historical record that is well known and quite simply ignored by the AGW cultists.

Google Übersetzer
 
I love it! When Spencer and Christy at UAH were cooking the data to show global cooling by using the opposite sign to correct for diurnal satellite drift, the deniers were saying that satellite data from UAH was the ONLY accurate data. Spencer is Stuttering LimpTard's climatologist. Now that the correct sign is being used, suddenly satellite data from UAH is flawed. :cuckoo:

To deniers, any data that confirms global warming, no matter how rabid a denier the source, is by definition "flawed." :rofl:
I don't deny the planet may be warming. I deny that man is causing it. The science simply doesn't support that conclusion.

I see. Then you claim that the absorbtion spectrum of the GHGs has been lied about by physicists since 1858?


No but you know something...the scientific instruments and methodologies have sort of improved since 1858. Imagine that. Way back in 1858 Wallace and Darwin were rocking the scientific world with their revolutionary "survival of the fittest".

Amazingly enough chemists were still using taste as one of the methods for classifying chemical compunds, rough work when you are tasting osmium :eek:

OSMIUM. - THE ENCYCLOPEDIA OF PURE MATERIA MEDICA By TIMOTHY F. ALLEN, A.M., M.D.

Please note how many of the references are to tests upon themselves. Leads to a very short lifetime. But hey that was the way they did it back then.

Hat makers were still using mercury to form the carcass of the hat they were making, thus leading to the term "mad as a hatter".

So no they weren't lying, it's just that science has moved on and we now can do the science better than they could.
 
But, but, but, but Mann used the EXACT SAME TECHNIQUES TO DERIVE HIS HOCKEY STICK (only because he is such a poor statistician and because he was basing it all on a single tree it got kinda fucked up)(oh damn I said a bad word...well in Mann's case it is deserved, he is the moral equivalent of a ...oh damn I can't say it...it's just to bad a description...even though it is accurate) so once again Bozo, ya can't have it both ways now can you!
What a load of crap.

Can you make a hockey stick without tree rings?
In the field of paleoclimatology, there are a variety of independent methods to determine past temperature changes: tree rings, ice cores, lake sediments, boreholes, stalagmites, etc. What do these independent methods find?

Surface temperature changes send thermal waves underground, cooling or warming the subterranean rock. Boreholes can be used to measure these changes. In Huang 2000, underground temperature measurements were examined from over 350 bore holes in North America, Europe, Southern Africa and Australia. Borehole reconstructions aren't able to give annual or even decadal variation, yielding only century-scale trends. What they find is that the 20th century is the warmest of the past five centuries. This provides independent confirmation that the Earth is warming dramatically (the blue line is the instrumental record).

Hockey_Stick_borehole.gif

Figure 1: Global surface temperature change over the last five centuries from boreholes (thick red line). Shading represents uncertainty. Blue line is a five year running average of HadCRUT global surface air temperature (Huang 2000).

Stalagmites (or speleothems) are formed from groundwater within underground caverns. As they're annually banded, the thickness of the layers are used as climate proxies. Figure 2 shows a Northern Hemisphere temperature reconstruction from stalagmites. While the uncertainty band (grey area) is significant, the temperature in the latter 20th Century exceeds the maximum estimate over the past 500 years.

Hockey_Stick_Stalagmite.gif

Figure 2: Northern Hemisphere annual temperature reconstruction from speleothem reconstructions shown with 2 standard error (shaded area) (Smith 2006).

Oerlemans 2005 used historical records of glacier length as a proxy for temperature. As the number of monitored glaciers diminishes in the past, the uncertainty grows accordingly. Nevertheless, temperatures in recent decades exceed the uncertainty range over the past 400 years.

Hockey_Stick_glacier.gif

Figure 3: Global mean temperature calculated form glaciers. The red vertical lines indicate uncertainty.

Of course, these examples only go back as far as 500 years - this doesn't even cover the Medieval Warm Period. When you combine all the various proxies, including ice cores, coral, lake sediments, glaciers, boreholes & stalagmites, it's possible to reconstruct Northern Hemisphere temperatures without tree-ring proxies going back 1,300 years (Mann 2008). The result is that temperatures in recent decades exceed the maximum proxy estimate (including uncertainty) for the past 1,300 years. When you include tree-ring data, you find the same result for the past 1,700 years.

NH_Temp_Reconstruction.gif

Figure 4: Composite Northern Hemisphere land and land plus ocean temperature reconstructions and estimated 95% confidence intervals. Shown for comparison are published Northern Hemisphere reconstructions (Mann 2008).

Paleoclimatology draws upon a range of proxies and methodologies to calculate past temperatures. This allows independent confirmation of the basic hockey stick result: that the past few decades are the hottest in the past 1,300 years.


Yes it does and those very same methods are being used to confirm that the MWP was indeed global and much warmer than the temps today. But my point is still relevant. Mann used data from (following extensive research) a single tree to generate his hockey stick. Below is an article that touches very lightly on Manns failings (which are vast)

'Hockey stick' graph was exaggerated - Telegraph

This link to a German site goes into extensive detail about the MWP and how prosperous it was. It has links to other books and articles that corroborate the historical record that is well known and quite simply ignored by the AGW cultists.

Google Übersetzer
Again, the hockey stick can and was demonstrated without any tree rings, so even if Mann's technique was questionable, it in no way disproves the hockey stick, it just calls Mann's graph into question and no other graph.

And the MWP was NOT warmer than today as the graphs clearly show. We would be well into a new Ice Age if the Industrial Revolution had not come along.

2000_Year_Temperature_Comparison.png
 
We would be well into a new Ice Age if the Industrial Revolution had not come along.

Can you really say such things with any confidence, given how complex the system really is?
Well, if you look at the natural pattern of Ice Ages and interglacial warm periods, each warm period was 10,000 years or less. This present one is now 12,000 years long. The Little Ice Age would have fit the natural cycle for the next full blown Ice Age, but SOMETHING interrupted it right around the time of the I R.

global_temp2.jpg
 
Don't you deniers realize when you say crap like that you completely discredit yourself? :cuckoo:

Not only does the chart not show a "STEADY RISE" the text in your link says outright, "Almost 80% of the net temperature increase observed has occurred in the nineteenth and twentieth centuries." The chart is nearly flat until the 1700s, the beginning of the Industrial Revolution, and then it rises sharply after the Industrial Revolution to the present. Your post shows how deniers see only what they want to see and therefore no amount of data will ever get them to see the truth.

78% of the global boreholes showed warming, but to a denier that doesn't mean that 78% of the globe was warming, it apparently means the globe overall was not warming. :cuckoo:
And 20% of the warming coming before the I R and 80% coming after the I R tells a denier that the I R had nothing to do with the warming. :cuckoo:

Figure 3 shows a steady rise on all continents since the 1500's. That is indisputable.
In typical CON$ervoFascist fashion, when caught lying CON$ just keep on lying. That's indisputable.

But you didn't bother looking at the chart, right?
 
We would be well into a new Ice Age if the Industrial Revolution had not come along.

Can you really say such things with any confidence, given how complex the system really is?

Of course they can! Who needs facts when your "Science" consists only of "peer review" by other EnviroMarxists?
 
What a load of crap.

Can you make a hockey stick without tree rings?
In the field of paleoclimatology, there are a variety of independent methods to determine past temperature changes: tree rings, ice cores, lake sediments, boreholes, stalagmites, etc. What do these independent methods find?

Surface temperature changes send thermal waves underground, cooling or warming the subterranean rock. Boreholes can be used to measure these changes. In Huang 2000, underground temperature measurements were examined from over 350 bore holes in North America, Europe, Southern Africa and Australia. Borehole reconstructions aren't able to give annual or even decadal variation, yielding only century-scale trends. What they find is that the 20th century is the warmest of the past five centuries. This provides independent confirmation that the Earth is warming dramatically (the blue line is the instrumental record).

Hockey_Stick_borehole.gif

Figure 1: Global surface temperature change over the last five centuries from boreholes (thick red line). Shading represents uncertainty. Blue line is a five year running average of HadCRUT global surface air temperature (Huang 2000).

Stalagmites (or speleothems) are formed from groundwater within underground caverns. As they're annually banded, the thickness of the layers are used as climate proxies. Figure 2 shows a Northern Hemisphere temperature reconstruction from stalagmites. While the uncertainty band (grey area) is significant, the temperature in the latter 20th Century exceeds the maximum estimate over the past 500 years.

Hockey_Stick_Stalagmite.gif

Figure 2: Northern Hemisphere annual temperature reconstruction from speleothem reconstructions shown with 2 standard error (shaded area) (Smith 2006).

Oerlemans 2005 used historical records of glacier length as a proxy for temperature. As the number of monitored glaciers diminishes in the past, the uncertainty grows accordingly. Nevertheless, temperatures in recent decades exceed the uncertainty range over the past 400 years.

Hockey_Stick_glacier.gif

Figure 3: Global mean temperature calculated form glaciers. The red vertical lines indicate uncertainty.

Of course, these examples only go back as far as 500 years - this doesn't even cover the Medieval Warm Period. When you combine all the various proxies, including ice cores, coral, lake sediments, glaciers, boreholes & stalagmites, it's possible to reconstruct Northern Hemisphere temperatures without tree-ring proxies going back 1,300 years (Mann 2008). The result is that temperatures in recent decades exceed the maximum proxy estimate (including uncertainty) for the past 1,300 years. When you include tree-ring data, you find the same result for the past 1,700 years.

NH_Temp_Reconstruction.gif

Figure 4: Composite Northern Hemisphere land and land plus ocean temperature reconstructions and estimated 95% confidence intervals. Shown for comparison are published Northern Hemisphere reconstructions (Mann 2008).

Paleoclimatology draws upon a range of proxies and methodologies to calculate past temperatures. This allows independent confirmation of the basic hockey stick result: that the past few decades are the hottest in the past 1,300 years.


Yes it does and those very same methods are being used to confirm that the MWP was indeed global and much warmer than the temps today. But my point is still relevant. Mann used data from (following extensive research) a single tree to generate his hockey stick. Below is an article that touches very lightly on Manns failings (which are vast)

'Hockey stick' graph was exaggerated - Telegraph

This link to a German site goes into extensive detail about the MWP and how prosperous it was. It has links to other books and articles that corroborate the historical record that is well known and quite simply ignored by the AGW cultists.

Google Übersetzer
Again, the hockey stick can and was demonstrated without any tree rings, so even if Mann's technique was questionable, it in no way disproves the hockey stick, it just calls Mann's graph into question and no other graph.

And the MWP was NOT warmer than today as the graphs clearly show. We would be well into a new Ice Age if the Industrial Revolution had not come along.

2000_Year_Temperature_Comparison.png

Your "reconstructed" graph is a fucking joke. In 2000, many of the lines, except the black one group at 0 and are trending down.
 
Figure 3 shows a steady rise on all continents since the 1500's. That is indisputable.
In typical CON$ervoFascist fashion, when caught lying CON$ just keep on lying. That's indisputable.

But you didn't bother looking at the chart, right?
Obviously YOU didn't!!!

The ONLY continent that shows a "stead rise" is Australia. All the other continents show a sudden and dramatic jump in the last century.
What the hell are you looking at???

I can't believe this! You're lying!

Huang Figure 3. I can't put the chart I can only link to the whole report

http://www.ldeo.columbia.edu/~peter/Resources/Seminar/readings/Huang_boreholeTemp_Nature'00.pdf

Page 2!

Ed is either blind, stupid or lying.
 
Yes it does and those very same methods are being used to confirm that the MWP was indeed global and much warmer than the temps today. But my point is still relevant. Mann used data from (following extensive research) a single tree to generate his hockey stick. Below is an article that touches very lightly on Manns failings (which are vast)

'Hockey stick' graph was exaggerated - Telegraph

This link to a German site goes into extensive detail about the MWP and how prosperous it was. It has links to other books and articles that corroborate the historical record that is well known and quite simply ignored by the AGW cultists.

Google Übersetzer
Again, the hockey stick can and was demonstrated without any tree rings, so even if Mann's technique was questionable, it in no way disproves the hockey stick, it just calls Mann's graph into question and no other graph.

And the MWP was NOT warmer than today as the graphs clearly show. We would be well into a new Ice Age if the Industrial Revolution had not come along.

2000_Year_Temperature_Comparison.png

Your "reconstructed" graph is a fucking joke. In 2000, many of the lines, except the black one group at 0 and are trending down.
Not hardly! The black one is direct instrument measurement and it blocks out the color of many of the other lines, but clearly shows warmer temps than the MWP. The dark red line is from glaciers sampled globally and clearly shows warmer temps after the MWP. The ONLY line that shows the MWP to be warmer is the light green line from a very limited number of tree rings in the northern hemisphere only, so of course, deniers use only the most incomplete and inaccurate data because it is the only data that supports their beliefs and they ignore everything else.
 
But you didn't bother looking at the chart, right?
Obviously YOU didn't!!!

The ONLY continent that shows a "stead rise" is Australia. All the other continents show a sudden and dramatic jump in the last century.
What the hell are you looking at???

I can't believe this! You're lying!

Huang Figure 3. I can't put the chart I can only link to the whole report

http://www.ldeo.columbia.edu/~peter/Resources/Seminar/readings/Huang_boreholeTemp_Nature'00.pdf

Page 2!

Ed is either blind, stupid or lying.
Well you are not blind and you only pretend to be stupid so you must be lying.

Clearly the last column representing the last century is dramatically higher than the previous 100 year columns in all the continents except Australia.

You obviously lie to yourself as well as everyone else. :cuckoo:
 
Again, the hockey stick can and was demonstrated without any tree rings, so even if Mann's technique was questionable, it in no way disproves the hockey stick, it just calls Mann's graph into question and no other graph.

And the MWP was NOT warmer than today as the graphs clearly show. We would be well into a new Ice Age if the Industrial Revolution had not come along.

2000_Year_Temperature_Comparison.png

Your "reconstructed" graph is a fucking joke. In 2000, many of the lines, except the black one group at 0 and are trending down.
Not hardly! The black one is direct instrument measurement and it blocks out the color of many of the other lines, but clearly shows warmer temps than the MWP. The dark red line is from glaciers sampled globally and clearly shows warmer temps after the MWP. The ONLY line that shows the MWP to be warmer is the light green line from a very limited number of tree rings in the northern hemisphere only, so of course, deniers use only the most incomplete and inaccurate data because it is the only data that supports their beliefs and they ignore everything else.

Ed, you have to stop lying, it's really absurd and blatant. Did you look at the chart you posted?

The red, orange, brown, blue are all trending down until some took a black marking and tried to hide them by posting the results from thermometers on tarmacs and in bovine anuses.

Really, you're making an embarrassment of yourself.

Look at the chart you posted, the lines trend DOWN
 
Obviously YOU didn't!!!

The ONLY continent that shows a "stead rise" is Australia. All the other continents show a sudden and dramatic jump in the last century.
What the hell are you looking at???

I can't believe this! You're lying!

Huang Figure 3. I can't put the chart I can only link to the whole report

http://www.ldeo.columbia.edu/~peter/Resources/Seminar/readings/Huang_boreholeTemp_Nature'00.pdf

Page 2!

Ed is either blind, stupid or lying.
Well you are not blind and you only pretend to be stupid so you must be lying.

Clearly the last column representing the last century is dramatically higher than the previous 100 year columns in all the continents except Australia.

You obviously lie to yourself as well as everyone else. :cuckoo:

Hey! There's progress! You actually looked at the chart on Figure 3 this time!!

Do you finally see how stupid you sounded previously?
 
Take another look at the Reconstructed Chart, Ed, you're on a roll now that you're actually looking at what you post
 
We would be well into a new Ice Age if the Industrial Revolution had not come along.

Can you really say such things with any confidence, given how complex the system really is?
Well, if you look at the natural pattern of Ice Ages and interglacial warm periods, each warm period was 10,000 years or less. This present one is now 12,000 years long. The Little Ice Age would have fit the natural cycle for the next full blown Ice Age, but SOMETHING interrupted it right around the time of the I R.

global_temp2.jpg


This is not true. Below is a link to one of the better studies on glacial ages and they have been able to determine that there were 4 glacial periods and if you look down at the graph your 10,000 year period is for only one interglacial period (the penultimate one as it happens) that between the Tioga and the Tenaya. Then the next interglacial from the Tenaya to the Tahoe 2 interglacial was 88,000 years. Then from the Tahoe 2 to the Tahoe 1 was another 70,000 years give or take.

So your interglacial figures are way off.

http://www.sscnet.ucla.edu/geog/downloads/297/240.pdf


EDIT: I should have said recent glacial periods.
 
Last edited:
I can't believe this! You're lying!

Huang Figure 3. I can't put the chart I can only link to the whole report

http://www.ldeo.columbia.edu/~peter/Resources/Seminar/readings/Huang_boreholeTemp_Nature'00.pdf

Page 2!

Ed is either blind, stupid or lying.
Well you are not blind and you only pretend to be stupid so you must be lying.

Clearly the last column representing the last century is dramatically higher than the previous 100 year columns in all the continents except Australia.

You obviously lie to yourself as well as everyone else. :cuckoo:

Hey! There's progress! You actually looked at the chart on Figure 3 this time!!

Do you finally see how stupid you sounded previously?
Like I said, you know you're lying.

You said all continents showed a steady rise over the 500 year period when the chart you pretend to be too stupid to understand shows only Australia to have a steady rise.

Originally Posted by CrusaderFrank

Figure 3 shows a steady rise on all continents since the 1500's. That is indisputable.
 
Can you really say such things with any confidence, given how complex the system really is?
Well, if you look at the natural pattern of Ice Ages and interglacial warm periods, each warm period was 10,000 years or less. This present one is now 12,000 years long. The Little Ice Age would have fit the natural cycle for the next full blown Ice Age, but SOMETHING interrupted it right around the time of the I R.

global_temp2.jpg


This is not true. Below is a link to one of the better studies on glacial ages and they have been able to determine that there were 4 glacial periods and if you look down at the graph your 10,000 year period is for only one interglacial period (the penultimate one as it happens) that between the Tioga and the Tenaya. Then the next interglacial from the Tenaya to the Tahoe 2 interglacial was 88,000 years. Then from the Tahoe 2 to the Tahoe 1 was another 70,000 years give or take.

So your interglacial figures are way off.

http://www.sscnet.ucla.edu/geog/downloads/297/240.pdf


EDIT: I should have said recent glacial periods.
My interglacial figures are from Antarctic ice cores, yours are for one tiny area in California.
 

Forum List

Back
Top