How those record temperatures were derived

When it read 104 in October, get back to me.

It gets hot in summer! Sweet Jesus!

Global Warming -- it's real!

If it read 104 in October there is a good chance life would have changed and not for the positive. Thus we need to do something now. Some people enjoy life and want to have their great grandchildren do the same. Some are ostriches, doesn't it get dark and lonely in your hole.
What is the optimum temperature of the Earth?
98.6 degrees Fahrenheit. Maye 185-ish in the sauna.
 
No matter how much you pretend to be a dumb liar, by now you know full well you are lying!

How many times have I busted you posting this same crap, and yet you still post it knowing full well it is nothing but deliberately deceptive lies crafted to deceive anyone who doesn't understand ANOMALIES!!!!!

Real scientists use ANOMALIES to correct for things like heat islands. As you well know, all the heat sources will do is create a warmer AVERAGE that the ANOMALY is measured against. The TREND shown by the ANOMALY will be quite accurate, as proven by the fact that the satellite data collected by deniers matches the ground station data almost exactly!!!!
parrot_in_a_hat-sm.jpg

Anomaly!...Denier!...Anomaly!...Denier!...Anomaly!...Denier!...Anomaly!...RAAAAAK!


heat island, gorite, heat island, gorite fascist jacobin fabian nazi socialist kenyan, RAAAK!


:rolleyes:
 
No matter how much you pretend to be a dumb liar, by now you know full well you are lying!

How many times have I busted you posting this same crap, and yet you still post it knowing full well it is nothing but deliberately deceptive lies crafted to deceive anyone who doesn't understand ANOMALIES!!!!!

Real scientists use ANOMALIES to correct for things like heat islands. As you well know, all the heat sources will do is create a warmer AVERAGE that the ANOMALY is measured against. The TREND shown by the ANOMALY will be quite accurate, as proven by the fact that the satellite data collected by deniers matches the ground station data almost exactly!!!!
parrot_in_a_hat-sm.jpg

Anomaly!...Denier!...Anomaly!...Denier!...Anomaly!...Denier!...Anomaly!...RAAAAAK!
And that is the same moronic reply you gave all the other times you knowingly posted the same lie. You would think you could come up with something new by now.

Insanity is doing the same thing over and over again and expecting different results.
- Albert Einstein
 
If it read 104 in October there is a good chance life would have changed and not for the positive. Thus we need to do something now. Some people enjoy life and want to have their great grandchildren do the same. Some are ostriches, doesn't it get dark and lonely in your hole.


Try reading some history books. The Roman Warming Period of a few hundred years was on average 2.7 degrees C warmer than today and life was good...very good in fact. The period witnessed widespread prosperity.

Jump forward to the Medieval Warming Period of several hundred years and you find the historical record once again shows widespread prosperity. Average temps were 2.4 degrees C warmer than today.

Now lets look at the times when it is cold.... Things don't look so good. Widespread poverty, wars, and famine. I know which temperature zone I want to live in. After reading some history books and determining the fact that I have not lied to you come back and tell us whether you would rather live while it is warmer or colder.
As you well know, none of the temps you cite were from direct instrument measurements, nor are they global. They come from PROXY data from very limited locations and cannot be HONESTLY equated to global direct instrument measurements.
But deniers are NEVER honest!


But, but, but, but Mann used the EXACT SAME TECHNIQUES TO DERIVE HIS HOCKEY STICK (only because he is such a poor statistician and because he was basing it all on a single tree it got kinda fucked up)(oh damn I said a bad word...well in Mann's case it is deserved, he is the moral equivalent of a ...oh damn I can't say it...it's just to bad a description...even though it is accurate) so once again Bozo, ya can't have it both ways now can you!
 
Last edited:
No matter how much you pretend to be a dumb liar, by now you know full well you are lying!

How many times have I busted you posting this same crap, and yet you still post it knowing full well it is nothing but deliberately deceptive lies crafted to deceive anyone who doesn't understand ANOMALIES!!!!!

Real scientists use ANOMALIES to correct for things like heat islands. As you well know, all the heat sources will do is create a warmer AVERAGE that the ANOMALY is measured against. The TREND shown by the ANOMALY will be quite accurate, as proven by the fact that the satellite data collected by deniers matches the ground station data almost exactly!!!!
parrot_in_a_hat-sm.jpg

Anomaly!...Denier!...Anomaly!...Denier!...Anomaly!...Denier!...Anomaly!...RAAAAAK!
And that is the same moronic reply you gave all the other times you knowingly posted the same lie. You would think you could come up with something new by now.

Insanity is doing the same thing over and over again and expecting different results.
- Albert Einstein


Wow what an accurate description of the AGW crowd. They have been predicting the SAME CRAP SINCE 1969 AND THEY HAVE NEVER BEEN CORRECT! In one case they were a measley 2950% off. DAMN that's good! I bet a MONKEY COULD DO BETTER!:lol::lol::lol:
 
Try reading some history books. The Roman Warming Period of a few hundred years was on average 2.7 degrees C warmer than today and life was good...very good in fact. The period witnessed widespread prosperity.

Jump forward to the Medieval Warming Period of several hundred years and you find the historical record once again shows widespread prosperity. Average temps were 2.4 degrees C warmer than today.

Now lets look at the times when it is cold.... Things don't look so good. Widespread poverty, wars, and famine. I know which temperature zone I want to live in. After reading some history books and determining the fact that I have not lied to you come back and tell us whether you would rather live while it is warmer or colder.
As you well know, none of the temps you cite were from direct instrument measurements, nor are they global. They come from PROXY data from very limited locations and cannot be HONESTLY equated to global direct instrument measurements.
But deniers are NEVER honest!


But, but, but, but Mann used the EXACT SAME TECHNIQUES TO DERIVE HIS HOCKEY STICK (only because he is such a poor statistician and because he was basing it all on a single tree it got kinda fucked up)(oh damn I said a bad word...well in Mann's case it is deserved, he is the moral equivalent of a ...oh damn I can't say it...it's just to bad a description...even though it is accurate) so once again Bozo, ya can't have it both ways now can you!
What a load of crap.

Can you make a hockey stick without tree rings?
In the field of paleoclimatology, there are a variety of independent methods to determine past temperature changes: tree rings, ice cores, lake sediments, boreholes, stalagmites, etc. What do these independent methods find?

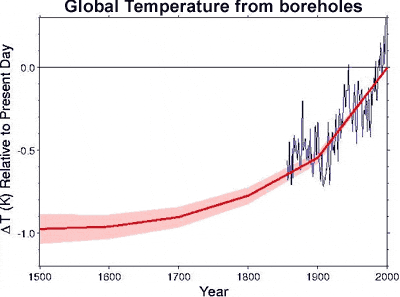
Surface temperature changes send thermal waves underground, cooling or warming the subterranean rock. Boreholes can be used to measure these changes. In Huang 2000, underground temperature measurements were examined from over 350 bore holes in North America, Europe, Southern Africa and Australia. Borehole reconstructions aren't able to give annual or even decadal variation, yielding only century-scale trends. What they find is that the 20th century is the warmest of the past five centuries. This provides independent confirmation that the Earth is warming dramatically (the blue line is the instrumental record).

Hockey_Stick_borehole.gif

Figure 1: Global surface temperature change over the last five centuries from boreholes (thick red line). Shading represents uncertainty. Blue line is a five year running average of HadCRUT global surface air temperature (Huang 2000).

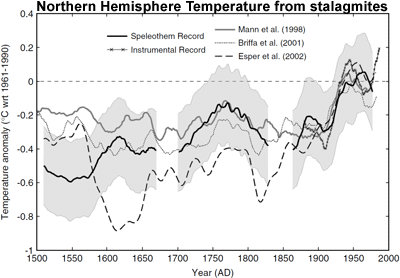
Stalagmites (or speleothems) are formed from groundwater within underground caverns. As they're annually banded, the thickness of the layers are used as climate proxies. Figure 2 shows a Northern Hemisphere temperature reconstruction from stalagmites. While the uncertainty band (grey area) is significant, the temperature in the latter 20th Century exceeds the maximum estimate over the past 500 years.

Hockey_Stick_Stalagmite.gif

Figure 2: Northern Hemisphere annual temperature reconstruction from speleothem reconstructions shown with 2 standard error (shaded area) (Smith 2006).

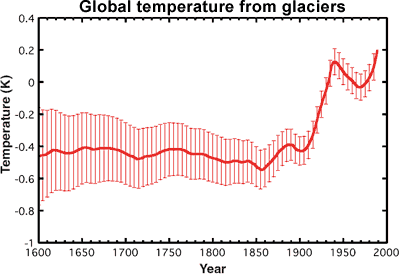
Oerlemans 2005 used historical records of glacier length as a proxy for temperature. As the number of monitored glaciers diminishes in the past, the uncertainty grows accordingly. Nevertheless, temperatures in recent decades exceed the uncertainty range over the past 400 years.

Hockey_Stick_glacier.gif

Figure 3: Global mean temperature calculated form glaciers. The red vertical lines indicate uncertainty.

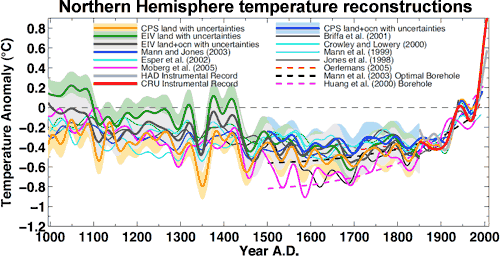
Of course, these examples only go back as far as 500 years - this doesn't even cover the Medieval Warm Period. When you combine all the various proxies, including ice cores, coral, lake sediments, glaciers, boreholes & stalagmites, it's possible to reconstruct Northern Hemisphere temperatures without tree-ring proxies going back 1,300 years (Mann 2008). The result is that temperatures in recent decades exceed the maximum proxy estimate (including uncertainty) for the past 1,300 years. When you include tree-ring data, you find the same result for the past 1,700 years.

NH_Temp_Reconstruction.gif

Figure 4: Composite Northern Hemisphere land and land plus ocean temperature reconstructions and estimated 95% confidence intervals. Shown for comparison are published Northern Hemisphere reconstructions (Mann 2008).

Paleoclimatology draws upon a range of proxies and methodologies to calculate past temperatures. This allows independent confirmation of the basic hockey stick result: that the past few decades are the hottest in the past 1,300 years.
 
if the record is within the measuring system of this one station, then it does not matter if there is asphalt etc.

unless they added the asphalt between the time point of the previous record point and the current.

duh.


Well give the person a ceegar 'cause that's exactly what has occured!

link, and please to the source not to the root homepage.
 
Yet, the temp curves from the UAH satellite data is almost exactly the same as the temps derived from these stations. Perhaps you dingbats are overlooking something?

Then obviously, the satellite data is flawed.

I see. The most prominent and scientifically acceptable of the critics is pimping for the warmists.

Don't lose your little tin hat, Dave. Never know when I am broadcasting :razz:
I didn't say he was pimping for the cult. His website makes it clear the cult's claims are flawed.
 
Yet, the temp curves from the UAH satellite data is almost exactly the same as the temps derived from these stations. Perhaps you dingbats are overlooking something?

Then obviously, the satellite data is flawed.
I love it! When Spencer and Christy at UAH were cooking the data to show global cooling by using the opposite sign to correct for diurnal satellite drift, the deniers were saying that satellite data from UAH was the ONLY accurate data. Spencer is Stuttering LimpTard's climatologist. Now that the correct sign is being used, suddenly satellite data from UAH is flawed. :cuckoo:

To deniers, any data that confirms global warming, no matter how rabid a denier the source, is by definition "flawed." :rofl:
I don't deny the planet may be warming. I deny that man is causing it. The science simply doesn't support that conclusion.
 
If it read 104 in October there is a good chance life would have changed and not for the positive. Thus we need to do something now. Some people enjoy life and want to have their great grandchildren do the same. Some are ostriches, doesn't it get dark and lonely in your hole.
What is the optimum temperature of the Earth?
98.6 degrees Fahrenheit. Maye 185-ish in the sauna.
:lol:
 
Then obviously, the satellite data is flawed.
I love it! When Spencer and Christy at UAH were cooking the data to show global cooling by using the opposite sign to correct for diurnal satellite drift, the deniers were saying that satellite data from UAH was the ONLY accurate data. Spencer is Stuttering LimpTard's climatologist. Now that the correct sign is being used, suddenly satellite data from UAH is flawed. :cuckoo:

To deniers, any data that confirms global warming, no matter how rabid a denier the source, is by definition "flawed." :rofl:
I don't deny the planet may be warming. I deny that man is causing it. The science simply doesn't support that conclusion.

I see. Then you claim that the absorbtion spectrum of the GHGs has been lied about by physicists since 1858?
 
Keep coming back to the simple notion: if the Warmers are correct (and they're clearly not), why can't they show a single laboratory experiment showing how a 200ppm, not 500,000PPM increase in CO2 causes an increase in temperature (3% increase has been alleged for the Antarctic).
 
http://www.ldeo.columbia.edu/~peter/Resources/Seminar/readings/Huang_boreholeTemp_Nature'00.pdf

Huang 2000. Mann has his tree rings and Huang has his boreholes.

In Figure 3 in the report, the boreholes show a steady rise in temperature over the past 500 years, also fully 25% of the boreholes did not show any "net warming over the past five centuries"

OK? About 1 in 4 of the boreholes did not show a rise using the Warmers own methodology and the warming has been occurring since 300 years before the start of the Industrial Age.
 
I love it! When Spencer and Christy at UAH were cooking the data to show global cooling by using the opposite sign to correct for diurnal satellite drift, the deniers were saying that satellite data from UAH was the ONLY accurate data. Spencer is Stuttering LimpTard's climatologist. Now that the correct sign is being used, suddenly satellite data from UAH is flawed. :cuckoo:

To deniers, any data that confirms global warming, no matter how rabid a denier the source, is by definition "flawed." :rofl:
I don't deny the planet may be warming. I deny that man is causing it. The science simply doesn't support that conclusion.

I see. Then you claim that the absorbtion spectrum of the GHGs has been lied about by physicists since 1858?
I claim the warming effects of CO2 have been vastly overblown. And now the cultists are claiming CO2 has changed its behavior. It's more "sensitive" than it was. What rubbish! :lol:

Water vapor is a far more powerful GHG. But we can't claim that American SUVs are putting out so much H2O it's going to kill us all unless we have global socialism, can we?

Ironic that the EnviroMarxist made the US Auto industry install catalytic converters in cars.

What does a catalytic converter do?

Wait for it

Wait

Wait

It converts Carbon Monoxide to Carbon dioxide!

:lol: :lol: :lol: :lol:
 
http://www.ldeo.columbia.edu/~peter/Resources/Seminar/readings/Huang_boreholeTemp_Nature'00.pdf

Huang 2000. Mann has his tree rings and Huang has his boreholes.

In Figure 3 in the report, the boreholes show a steady rise in temperature over the past 500 years, also fully 25% of the boreholes did not show any "net warming over the past five centuries"

OK? About 1 in 4 of the boreholes did not show a rise using the Warmers own methodology and the warming has been occurring since 300 years before the start of the Industrial Age.
Don't you deniers realize when you say crap like that you completely discredit yourself? :cuckoo:

Not only does the chart not show a "STEADY RISE" the text in your link says outright, "Almost 80% of the net temperature increase observed has occurred in the nineteenth and twentieth centuries." The chart is nearly flat until the 1700s, the beginning of the Industrial Revolution, and then it rises sharply after the Industrial Revolution to the present. Your post shows how deniers see only what they want to see and therefore no amount of data will ever get them to see the truth.

78% of the global boreholes showed warming, but to a denier that doesn't mean that 78% of the globe was warming, it apparently means the globe overall was not warming. :cuckoo:
And 20% of the warming coming before the I R and 80% coming after the I R tells a denier that the I R had nothing to do with the warming. :cuckoo:
 
I love it! When Spencer and Christy at UAH were cooking the data to show global cooling by using the opposite sign to correct for diurnal satellite drift, the deniers were saying that satellite data from UAH was the ONLY accurate data. Spencer is Stuttering LimpTard's climatologist. Now that the correct sign is being used, suddenly satellite data from UAH is flawed. :cuckoo:

To deniers, any data that confirms global warming, no matter how rabid a denier the source, is by definition "flawed." :rofl:
I don't deny the planet may be warming. I deny that man is causing it. The science simply doesn't support that conclusion.

I see. Then you claim that the absorbtion spectrum of the GHGs has been lied about by physicists since 1858?

Provide us a scientific experiment that proves this. You claim CO2 is causing it, Go ahead conduct an experiment that proves this.

It's actually trivial. A few seconds in a spectrophotometer and you'll have your proof that CO2 absorbs infra-red radiation. Since it does it in the lab, there's nothing that would perclude it happening in the atmosphere. Get enough CO2, absorbing enough energy, and warming is inevitable.
 
http://www.ldeo.columbia.edu/~peter/Resources/Seminar/readings/Huang_boreholeTemp_Nature'00.pdf

Huang 2000. Mann has his tree rings and Huang has his boreholes.

In Figure 3 in the report, the boreholes show a steady rise in temperature over the past 500 years, also fully 25% of the boreholes did not show any "net warming over the past five centuries"

OK? About 1 in 4 of the boreholes did not show a rise using the Warmers own methodology and the warming has been occurring since 300 years before the start of the Industrial Age.
Don't you deniers realize when you say crap like that you completely discredit yourself? :cuckoo:

Not only does the chart not show a "STEADY RISE" the text in your link says outright, "Almost 80% of the net temperature increase observed has occurred in the nineteenth and twentieth centuries." The chart is nearly flat until the 1700s, the beginning of the Industrial Revolution, and then it rises sharply after the Industrial Revolution to the present. Your post shows how deniers see only what they want to see and therefore no amount of data will ever get them to see the truth.

78% of the global boreholes showed warming, but to a denier that doesn't mean that 78% of the globe was warming, it apparently means the globe overall was not warming. :cuckoo:
And 20% of the warming coming before the I R and 80% coming after the I R tells a denier that the I R had nothing to do with the warming. :cuckoo:

Figure 3 shows a steady rise on all continents since the 1500's. That is indisputable.
 
I see. Then you claim that the absorbtion spectrum of the GHGs has been lied about by physicists since 1858?

Provide us a scientific experiment that proves this. You claim CO2 is causing it, Go ahead conduct an experiment that proves this.

It's actually trivial. A few seconds in a spectrophotometer and you'll have your proof that CO2 absorbs infra-red radiation. Since it does it in the lab, there's nothing that would perclude it happening in the atmosphere. Get enough CO2, absorbing enough energy, and warming is inevitable.

I know why you do this, it's because the lab experiments do NOT support your hypotheses so you fall back to the low-brow "CO2 really is a GHG!!" argument.

It is the supposition of the Warmers (that's you and OR) that if you isolate all other variables except for deminimus increases in CO2 (200PPM) you will see a measurable (supposedly 2.7 degrees in the Antarctic) increase in temperature.

All I ask is: prove it.

Show me in a Laboratory setting how this works.

You've not done it once, yet you keep raising the bar on how devastating increases in now sensitive CO2 is on temperature.
 

Forum List

Back
Top