Houston's chemical pollution and Trump's firing half the EPA will revive that debate after Harvey.

All your talk billo and still not the first shred of observed, measured, quantified evidence that supports AGW over natural variability...if NOAA, NASA, et al were actually involved in science, they would have volumes of the stuff for you to throw at me...but do they? Of course not...not the first piece of actual evidence..
 
No...debunked by actual research and a look at the facts

97 Articles Refuting The "97% Consensus" | Climate Change Dispatch

"The 97% “consensus” study, Cook et al. (2013) has been thoroughly refuted in scholarly peer-reviewed journals, by major news media, public policy organizations and think tanks, highly credentialed scientists and extensively in the climate blogosphere. The shoddy methodology of Cook’s study has been shown to be so fatally flawed that well known climate scientists have publicly spoken out against it,"

The ‘97% consensus’ article is poorly conceived, poorly designed and poorly executed. It obscures the complexities of the climate issue and it is a sign of the desperately poor level of public and policy debate in this country [UK] that the energy minister should cite it.”

Summary: Cook et al. (2013) attempted to categorize 11,944 abstracts of papers (not entire papers) to their level of endorsement of AGW and found 7930 (66%) held no position on AGW. While only 65 papers (0.5%) explicitly endorsed and quantified AGW as +50% (Humans are the primary cause). Their methodology was so fatally flawed that they falsely classified skeptic papers as endorsing AGW, apparently believing to know more about the papers than their authors. Cook et al.’s author self-ratings simply confirmed the worthlessness of their methodology, as they were not representative of the sample since only 4% of the authors (1189 of 29,083) rated their own papers and of these 63% disagreed with their abstract ratings.

In short billo...the 97% myth is a lie based on flawed methodology, and good old bullshit.

Fact Checking The Claim Of 97% Consensus On Anthropogenic Climate Change


I said that the political heads of those organizations support the AGW hypothesis...the rank and file scientists that belong to those organizations do not...they don't get a vote on the policy policy of the management...

And once again, your appeal to authority fallacy can be easily put down with one single challenge that you simply can not answer.

Can you provide a single piece of observed, measured, quantified evidence that supports the AGW hypothesis over natural variability?

If 97% of the scientists in the world agree with the AGW hypothesis, surely there must be some observed, measured, quantified evidence supporting the AGW hypothesis over all other hypotheses...Lets see just a single piece of it....and do keep in mind that evidence of change is not evidence of what caused the change. And if you can't provide that single shred of evidence I am asking for...which I already know you can't....if you were even fractionally as smart as you think you are....you would ask yourself, exactly what they are basing their position on...if it isn't actual evidence that supports the hypothesis, what else is there?
Nice hit piece. Character assassination is what you fuckers do best. However, your debunked claim about the Cook report, is just more bullshit from the bullshitters.

The climate myth:
97% consensus on human-caused global warming has been disproven Cooks ’97% consensus’ disproven by a new peer reviewed paper showing major math errors (Anthony Watts)


Communicating the expert consensus is very important in terms of increasing public awareness of human-caused climate change and support for climate solutions. Thus it's perhaps not surprising that Cook et al. (2013) and its 97% consensus result have been the subject of extensive denial among the usual climate contrarian suspects. After all, the fossil fuel industry, right-wing think tanks, and climate contrarians have been engaged in a disinformation campaign regarding the expert climate consensus for over two decades. For example, Western Fuels Association conducted a half-million dollar campaign in 1991 designed to ‘reposition global warming as theory (not fact).’

The 97% Consensus is a Robust Result
Nevertheless, the existence of the expert consensus on human-caused global warming is a reality, as is clear from an examination of the full body of evidence. For example, Naomi Oreskes found no rejections of the consensus in a survey of 928 abstracts performed in 2004. Doran & Zimmerman (2009) found a 97% consensus among scientists actively publishing climate research. Anderegg et al. (2010) reviewed publicly signed declarations supporting or rejecting human-caused global warming, and again found over 97% consensus among climate experts. Cook et al. (2013) found the same 97% result through a survey of over 12,000 climate abstracts from peer-reviewed journals, as well as from over 2,000 scientist author self-ratings, among abstracts and papers taking a position on the causes of global warming.

In addition to these studies, we have the National Academies of Science from 33 different countries all endorsing the consensus. Dozens of scientific organizations have endorsed the consensus on human-caused global warming. Only one has ever rejected the consensus - the American Association of Petroleum Geologists - and even they shifted to a neutral position when members threatened to not renew their memberships due to its position of climate denial.

In short, the 97% consensus on human-caused global warming is a robust result, found using several different methods in various studies over the past decade. It really shouldn't be a surprise at this point, and denying it is, well, denial.

What I find hard to understand, is why is this so important to you?
 
All your talk billo and still not the first shred of observed, measured, quantified evidence that supports AGW over natural variability...if NOAA, NASA, et al were actually involved in science, they would have volumes of the stuff for you to throw at me...but do they? Of course not...not the first piece of actual evidence..
I posted it. It's not my problem if you're too pussy to read it.
 
The very fact that you believe government is trustworthy on anything tells me that you aren't very bright.
The fact that you think you're smarter than the people whose job it is to measure sea levels, CO2 in the air, etc., shows you're a home schooled dumbass who watches too much TV.
 
If you don't even know that actual science is defined as empirical study then you are out of your depth and have shown conclusively that you don't have the first clue when it comes to science.
If you want to argue semantics, then go fuck yourself. I posted the definition of empirical. I gave you an example of how it can go awry. I've also posted scientific data from credible sources. The fact that you keep trying to make this about me, says a lot about you.
You wouldn't know what empirical evidence was even if it hit you up the side of the head... "credible sources" says who? COOK Et Al is not a credible source and neither are Tom Karl or Gavin Schmidt. They both like to do fantasy modeling and call it "empirical evidence" which it is not. Modeling is fantasy contrived data that has been extrapolated and is dependent on arbitrary inputs. (this is how they 'tweek' a model to look right in the past, but when allowed to run the predictive phase, they run off the charts and fail empirical evidence review. Below are 75 examples of the best GCM's. And they all fail inside 3 years.

cmip5-73-models-vs-obs-20n-20s-mt-5-yr-means11 Dr Roy Spencer.png
 
You wouldn't know what empirical evidence was even if it hit you up the side of the head... "credible sources" says who? COOK Et Al is not a credible source and neither are Tom Karl or Gavin Schmidt. They both like to do fantasy modeling and call it "empirical evidence" which it is not. Modeling is fantasy contrived data that has been extrapolated and is dependent on arbitrary inputs. (this is how they 'tweek' a model to look right in the past, but when allowed to run the predictive phase, they run off the charts and fail empirical evidence review. Below are 75 examples of the best GCM's. And they all fail inside 3 years.

View attachment 149478
What do you mean by "fail"? When a model fails, what is that exactly?

BTW, you don't need modeling to prove global warming is man-made. There are other observable events you can witness without modeling. Like Greenland's receding ice shelf. Like the probable extinction of polar bears at the north pole. The smog in China. Are you going to tell me they had that much smog before the industrial revolution?
LOL

Lets burn your straw-men to the ground..

The Greenland ice shelf gained over 9 feet of thickness this year alone and in the last 10 years has expanded so greatly that calving has again started due to the weight of the new ice pushing it down the mountain. Its funny that you use a naturally occurring event that is so easily shown to be natural consequences of increasing ice. Strawman one is now ashes

The polar bears have increased in numbers to well over 250,000 where just 20 years ago their numbers were below 100,000. Again the warmer region and less ice have made it easier for the bears to gain food and survive... Strawman two is now ashes..

Smog in china? What the hell does that have to do with anything other that not choosing to use current technology to scrub the particulates from their stacks like we do in the states? Strawman three is now ashes...

Models fail when their predictive phase fails to reproduce reality..None of your modeling has modeled reality (Observed physical-empirical evidence). Strawman 4 now ashes...

O for 4

Nice score...
 
Last edited:
What do you mean by "fail"? When a model fails, what is that exactly?

You really don't have much of a grasp on the science do you? Clearly you are a victim of the media and your politics as you clearly haven't spent much time looking at the science...clearly you can't even identify science.

The models represent the present understanding of how energy moves through the system, and applies that knowledge to their understanding of the physics at work. When the model fails, that means that climate science at present does not have a good understanding of how energy moves through the system, nor do they have a firm grasp of the physics at work within the system.

Models can be very useful if the understanding of the physics in operation is good. For example, aircraft designs can be pretty thoroughly tested via modeling before the first actual part is ever fabricated and the end product will perform in a very similar manner as the computer model..same for all manner of other applications..electric motors, hydroelectric motors, elevators, bridges, and on and on...and the models reflect what happens in reality to a very high degree.

Not so with climate models..they almost universally run to hot because the are programmed with the assumption that CO2 causes warming...among other flaws in their understanding. When the model fails that means that the understanding of the system and physics in operation is flawed....otherwise the model would produce results that reflect reality.

BTW, you don't need modeling to prove global warming is man-made. There are other observable events you can witness without modeling. Like Greenland's receding ice shelf.

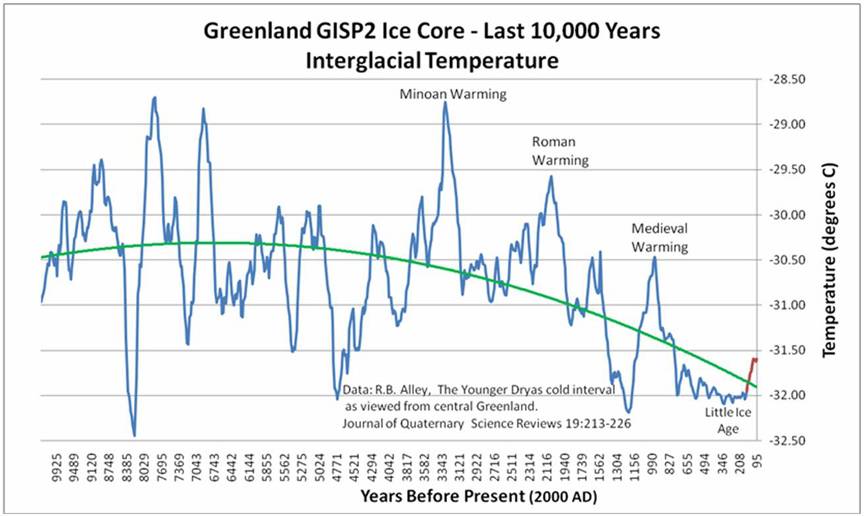
Do you think that Greenland's ice shelf has never changed? The fact is that it is larger now than it has been for most of the past 10,000 years...gold standard temperature reconstructions made from ice cores taken in greenland tell us that...here have a look...this temperature reconstruction is considered the gold standard...even by climate scientists...The ice core was taken in greenland and represents the past 10,000 years to the highest degree possible...we have no better proxy than ice cores.

This ice core reconstruction clearly shows that the temperature is cooler now than it has been for most of the past 10,000 years and that tells us that the ice in greenland is at a greater extent now than it has been for most of the past 10,000 years...unless you believe that somehow past warm temperatures didn't melt ice in the same way as present warm temperatures do....is that what you believe?

Lappi_Greenland_ice_core_10000yrs.jpg


Like the probable extinction of polar bears at the north pole.

Since 99% of the species that ever existed on earth are extinct and went extinct before man ever showed up on the scene, the claim of a species going extinct is hardly evidence that man is causing climate change...as to polar bears going extinct...even climate science no longer holds up polar bears as the poster child of global warming. The polar bear populations are growing at a rapid clip. Hell, just take a look at the above temperature reconstruction...it has been considerably warmer for most of the past 10,000 years than it is at present...how do you suppose they survived then? The climate isn't a problem for polar bears.

Global population of polar bears has increased by 2,650-5,700 since 2001

Climate myths: Polar bear numbers are increasing

The smog in China.

And it never fails, you poor dupes inevitably bring up some pollution problem and try to pass it off as climate change...pollution and climate change are two separate issues...one we could do something about...one is out of our control but we are wasting so much money on it, that there is none left to address the problem that we could start to solve.
 
I posted it. It's not my problem if you're too pussy to read it.

I read it...which is why I am still asking for a single piece of observed, measured, quantified evidence that supports AGW over natural variability...all your "evidence" did was show how little you actually know, and how easily you have been duped.

Lets look at what passes for evidence of man made climate change in your mind...

You posted this...

sea-surface-temp-figure1-2016.png


It shows a temperature increase of about 3/4 of a degree since 1880...a period of 136 years, with a margin of error of up to half a degree.

This gold standard temperature reconstruction shows temperature increases, and decreases that are larger than anything we have seen and happening faster than our piddling temperature increase multiple times over the past 10,000 years. It clearly shows that natural variability easily swamps any temperature changes we have seen. So I am not sure how you believe your graph showing about 3/4 of a degree of temperature change over a period of 136 years is evidence that mankind is responsible for any change in the global climate at all.

Lappi_Greenland_ice_core_10000yrs.jpg


Then you posted this...

15_co2_left_061316.jpg


It shows CO2 levels all the way up to 400ppm...wow. But what sort of CO2 numbers can be found if we look at the past...This is paleogeology's best estimate at what the CO2 concentrations and temperature of the planet have looked like over the past 600 million years...The blue line is temperature, the black line is CO2.

Note how often ice ages have began with CO2 levels hundreds of times higher than the present. The ice age that the earth is presently climbing out of began with CO2 levels at about 1000 ppm, relative to earth history, the atmosphere is positively starved for CO2.

%231%20CO2EarthHistory.gif


And new research calls into question whether we are having any effect on the total CO2 concentrations in the atmosphere at all.

https://www.researchgate.net/public...SPHERIC_CO2_TO_ANTHROPOGENIC_EMISSIONS_A_NOTE

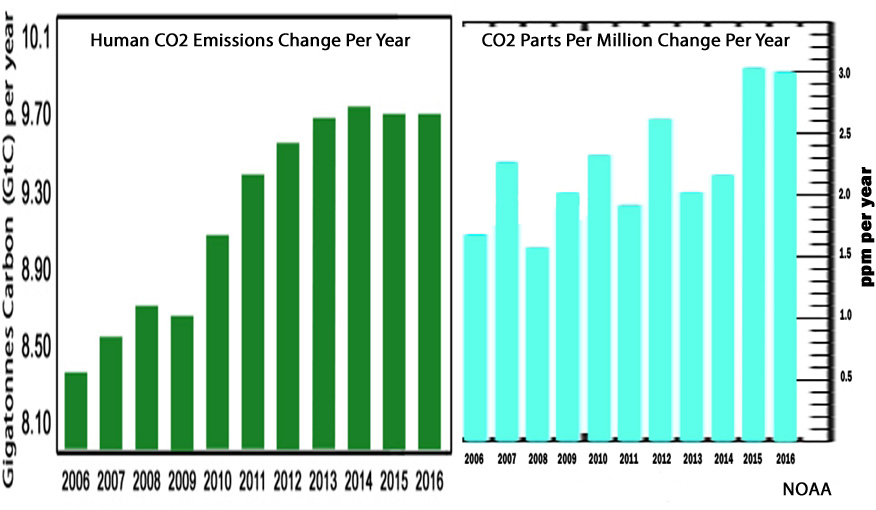
A necessary condition for the theory of anthropogenic global warming isthat there should be a close correlation between annual fluctuations of atmospheric CO2 and the annual rate of anthropogenic CO2 emissions.Data on atmospheric CO2 and anthropogenic emissions provided by the Mauna Loa measuring station and the CDIAC in the period 1959-2011 were studied using detrended correlation analysis to determine whether, net of their common long term upward trends, the rate of change in atmospheric CO2 is responsive to the rate of anthropogenic emissions in a shorter time scale from year to year. … [R]esults do not indicate a measurable year to year effect of annual anthropogenicemissions on the annual rate of CO2 accumulation in the atmosphere.”

CO2-Emissions-vs-CO2-ppm-concentration.jpg


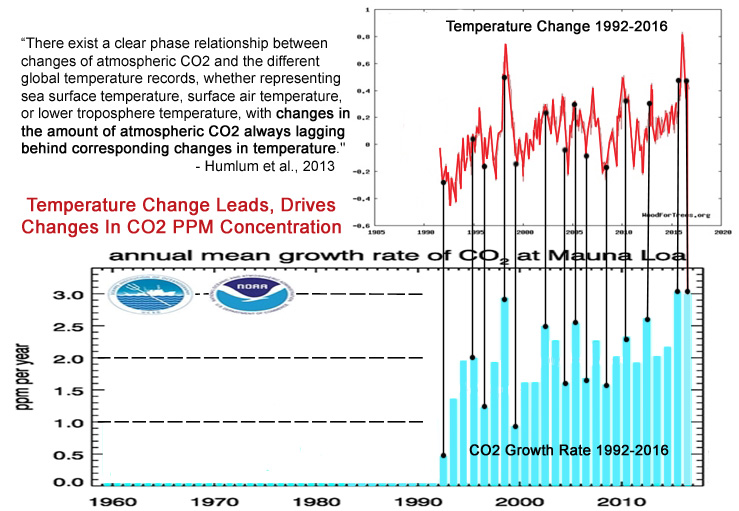
https://www.researchgate.net/public...spheric_carbon_dioxide_and_global_temperature

Temperature-Change-Leads-CO2-Growth-Change.jpg


Conclusion:
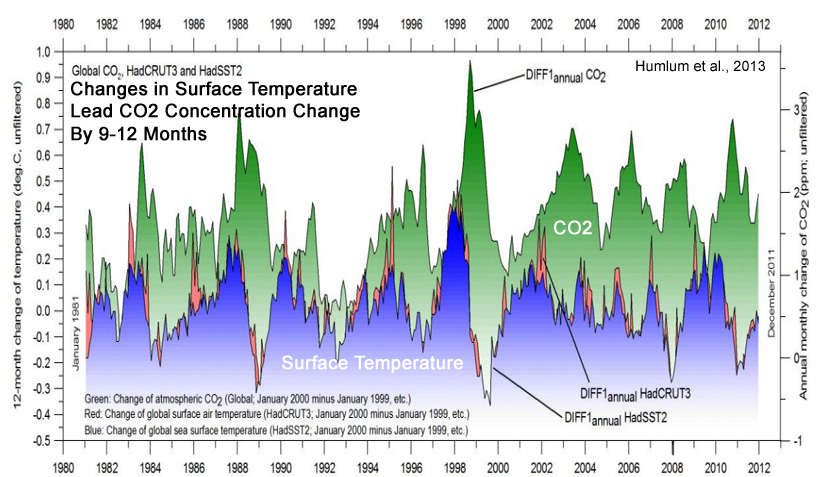
“There exist a clear phase relationship between changes of atmospheric CO2 and the different global temperature records, whetherrepresenting sea surface temperature, surface air temperature, or lower troposphere temperature, with changes in the amount of atmospheric CO2 always lagging behind corresponding changes in temperature.”
(1) The overall global temperature change sequence of events appears to be from 1) the ocean surface to 2) the land surface to 3) the lower troposphere.
(2) Changes in global atmospheric CO2 are lagging about 11–12 months behind changes in global sea surface temperature.
(3) Changes in global atmospheric CO2 are lagging 9.5–10 months behind changes in global air surface temperature.
(4) Changes in global atmospheric CO2 are lagging about 9 months behind changes in global lower troposphere temperature.
(5) Changes in ocean temperatures appear to explain a substantial part of the observed changes in atmospheric CO2 since January 1980.
(6) CO2 released from anthropogenic sources apparently has little influence on the observed changes in atmospheric CO2, and changes in atmospheric CO2 are not tracking changes in human emissions.
(7) On the time scale investigated, the overriding effect of large volcanic eruptions appears to be a reduction of atmospheric CO2, presumably due to the dominance of associated cooling effects from clouds associated with volcanic gases/aerosols and volcanic debris.
(8) Since at least 1980 changes in global temperature, and presumably especially southern ocean temperature, appear to represent a major control on changes in atmospheric CO2.


Temperature-Change-Leads-CO2-Growth-Change-Humulum-2013.jpg


SAGE Journals: Your gateway to world-class journal research

“[T]he warming and cooling of the ocean waters control how much CO2 is exchanged with atmosphere and thereby controlling the concentration of atmospheric CO2. It is obvious that when the oceans are cooled, in this case due to volcanic eruptions or La Niña events, they release less CO2 and when it was an extremely warm year, due to an El Niño, the oceans release more CO2. [D]uring the measured time 1979 to 2006 there has been a continued natural increase in temperature causing a continued increase of CO2 released into the atmosphere. This implies that temperature variations caused by El Niños, La Niñas, volcanic eruptions, varying cloud formations and ultimately the varying solar irradiation control the amount of CO2 which is leaving or being absorbed by the oceans.”

http://pubs.acs.org/doi/abs/10.1021/ef800581r

“[With the short (5−15 year) RT [residence time] results shown to be in quasi-equilibrium, this then supports the (independently based) conclusion that the long-term (∼100 year) rising atmospheric CO2 concentration is not from anthropogenic sources but, in accordance with conclusions from other studies, is most likely the outcome of the rising atmospheric temperature, which is due to other natural factors. This further supports the conclusion that global warming is not anthropogenically driven as an outcome of combustion.”

https://sci-hub.cc/http://journals.sagepub.com/doi/abs/10.1260/095830509789876772

The increase rate of atmospheric carbon dioxide for the period from 1980 to 2007 can be statistically explained as being a function solely of the global mean temperature. Throughout the period, the temperature differences seem to have caused differences around a base trend of 1.5 ppmv/year. The atmospheric CO2 increase rate was higher when the globe was warmer, and the increase rate was lower when the globe was cooler. This can be explained by wind patterns, biological processes, or most likely by the fact that a warmer ocean can hold less carbon dioxide. This finding indicates that knowledge of the rate of anthropogenic emission is not needed for estimation of the increase rate of atmospheric carbon dioxide.”


http://www.ipcc.ch/publications_and_data/ar4/wg1/en/faq-6-1.html

Atmospheric CO2 follows temperature changes in Antarctica with a lag of some hundreds of years.”


http://www.academia.edu/4466801/Landi_et_al_2013

“[F]rom 130.5 to 129,000 years ago, the rise in atmospheric CO2 concentrations lagged that of Antarctic temperature unequivocally….At mid-slope, there is an unequivocal lead of δ15N[temperature] over CO2 of 900 ± 325 yr”.


https://www.clim-past.net/9/2507/2013/cp-9-2507-2013.html

“Furthermore, a 5,000 yr lag in the CO2 decline relative to EDC [East Antarctica] temperatures is confirmed during the glacial inception at the end of MIS5.5 (120,000 yrs before present).”


http://iopscience.iop.org/article/10.1088/1748-9326/8/1/011006/meta

“However, it is the dependence of the airborne fraction on fossil fuel emission rate that makes the post-2000 downturn of the airborne fraction particularly striking. The change of emission rate in 2000 from 1.5% yr-1 [1960-2000] to 3.1% yr-1 [2000-2011], other things being equal, would [should] have caused a sharp increase of the airborne fraction

erl459410f3_online.jpg


And I could go on and on and on with peer reviewed published data that contradicts your beliefs. Your argument is so weak it is pathetic and it demonstrates that you really don't have a grasp of the issues. Your presentation is on par with the indoctrination little kids get in grade school in an attempt to have them grow up to be good little eco warriors. Is that what you are?...a kid whose only exposure to climate is the pseudoscience that activists provide in grade school textbooks...it is obvious that you have never actually looked at the science....probably because you simply can't understand it even at a basic level.

Then there was the photo of the Muir glacier showing an ice loss in a period of 60 years that was smaller than a previous ice loss in 15 years...

So clearly I looked at your information and have refuted it with actual science...peer reviewed journal articles and gold standard temperature reconstructions. Now lets see if you can refute me point by point with actual science or if it is actually you who pussy's out and offers up nothing but another limp wristed panty waist argument in support of your belief.

So do tell billo...exactly how do you believe any of the tripe that you have posted supports the AGW hypothesis over natural variability....
 
LOL

Lets burn your straw-men to the ground..

The Greenland ice shelf gained over 9 feet of thickness this year alone and in the last 10 years has expanded so greatly that calving has again started due to the weight of the new ice pushing it down the mountain. Its funny that you use a naturally occurring event that is so easily shown to be natural consequences of increasing ice. Strawman one is now ashes

The polar bears have increased in numbers to well over 250,000 where just 20 years ago their numbers were below 100,000. Again the warmer region and less ice have made it easier for the bears to gain food and survive... Strawman two is now ashes..

Smog in china? What the hell does that have to do with anything other that not choosing to use current technology to scrub the particulates from their stacks like we do in the states? Strawman three is now ashes...

Models fail when their predictive phase fails to reproduce reality..None of your modeling has modeled reality (Observed physical-empirical evidence). Strawman 4 now ashes...

O for 4

Nice score...

His arguments and reasons for believing that man is causing climate change sounds suspiciously like the sort of indoctrination grade school kids get in an attempt to have them grow up to be good little eco warriors....very light on anything that even resembles real science....heavy on belief in what they have been told by authority figures.
 
LOL

Lets burn your straw-men to the ground..

The Greenland ice shelf gained over 9 feet of thickness this year alone and in the last 10 years has expanded so greatly that calving has again started due to the weight of the new ice pushing it down the mountain. Its funny that you use a naturally occurring event that is so easily shown to be natural consequences of increasing ice. Strawman one is now ashes
This doesn't look like expansion to me.


The polar bears have increased in numbers to well over 250,000 where just 20 years ago their numbers were below 100,000. Again the warmer region and less ice have made it easier for the bears to gain food and survive... Strawman two is now ashes..
"...less ice..."? You do realize that less ice, means more water? And more water, means less land. And that a polar bear, is not a fish. So how the fuck, could it be easier, you hayseed-dickboy?


Smog in china? What the hell does that have to do with anything other that not choosing to use current technology to scrub the particulates from their stacks like we do in the states? Strawman three is now ashes...
The smog in China is the result of burning fossil fuels, you dumbass. It is something you can see with the naked eye. You don't need no "model" to show you that.

Models fail when their predictive phase fails to reproduce reality..None of your modeling has modeled reality (Observed physical-empirical evidence). Strawman 4 now ashes...
What does that mean?

"...predictive phase fails to reproduce reality..."

You wouldn't know reality if you took it rectally.

O for 4

Nice score...
That's a letter "O", not the number "0" (zero).

Maybe this subject is a little over your head? May I suggest the "bounce ball" thread would be more to your speed?
 
I read it...which is why I am still asking for a single piece of observed, measured, quantified evidence that supports AGW over natural variability...all your "evidence" did was show how little you actually know, and how easily you have been duped.
Posting the findings of science organizations like NOAA, proves I don't know anything? Did you ever think the fact that you questioning the findings of these professional organizations, shows you don't know anything or are so arrogant, you think you could bullshit your way through this discussion with some big ass data dump?

Lets look at what passes for evidence of man made climate change in your mind...

You posted this...


It shows a temperature increase of about 3/4 of a degree since 1880...a period of 136 years, with a margin of error of up to half a degree.
It proves the temperature is rising.

This gold standard temperature reconstruction...
Let the data dump begin.

shows temperature increases, and decreases that are larger than anything we have seen and happening faster than our piddling temperature increase multiple times over the past 10,000 years. It clearly shows that natural variability easily swamps any temperature changes we have seen. So I am not sure how you believe your graph showing about 3/4 of a degree of temperature change over a period of 136 years is evidence that mankind is responsible for any change in the global climate at all.

Lappi_Greenland_ice_core_10000yrs.jpg
What is that? The temperature of a glacier?

Then you posted this...

It shows CO2 levels all the way up to 400ppm...wow. But what sort of CO2 numbers can be found if we look at the past...This is paleogeology's best estimate at what the CO2 concentrations and temperature of the planet have looked like over the past 600 million years...The blue line is temperature, the black line is CO2.
An estimate? What I showed was measured. It was not an estimate. I'm not interested in your data dump.

And I could go on and on and on with peer reviewed published data that contradicts your beliefs. Your argument is so weak it is pathetic and it demonstrates that you really don't have a grasp of the issues. Your presentation is on par with the indoctrination little kids get in grade school in an attempt to have them grow up to be good little eco warriors. Is that what you are?...a kid whose only exposure to climate is the pseudoscience that activists provide in grade school textbooks...it is obvious that you have never actually looked at the science....probably because you simply can't understand it even at a basic level.
And you just like to hear yourself talk.

Then there was the photo of the Muir glacier showing an ice loss in a period of 60 years that was smaller than a previous ice loss in 15 years...
Because of your cartoon?

So clearly I looked at your information and have refuted it with actual science...peer reviewed journal articles and gold standard temperature reconstructions.
Now this, I want to thank you for. That's more than many people would've done on this board. I don't agree you refuted it, but I am thankful you went to the trouble of trying to address the points I made.

Now lets see if you can refute me point by point with actual science or if it is actually you who pussy's out and offers up nothing but another limp wristed panty waist argument in support of your belief.
I'm not a pussy. I'm also not an expert on climate change. So I do my research one step at a time. And so far, I'm not sold on these large modeling based explanations. I am sold on the findings of these science organizations, because it is their job to monitor and record their findings.

Now the problem is, you're on the same side as Trump. Who is deliberately purging scientists out of the government and replacing them with fossil fuel shills that are pushing oil and gas propaganda.

So do tell billo...exactly how do you believe any of the tripe that you have posted supports the AGW hypothesis over natural variability....
There you go again with that bullshit doublespeak.
 
Posting the findings of science organizations like NOAA, proves I don't know anything?

What findings did you post that support the AGW hypothesis over natural variability. Posting findings that the climate is changing doesn't even begin to support a reason as to why it is changing...

Did you ever think the fact that you questioning the findings of these professional organizations, shows you don't know anything or are so arrogant, you think you could bullshit your way through this discussion with some big ass data dump?

What did I question? Sure the climate is changing....sure it has warmed a fraction of a degree in the past 150 years...sure the atmospheric CO2 has increased...so what? When you look at the longer view, you see that it has warmed more, and warmed more in shorter periods of time than anything we have seen...and CO2 has been much higher than it is at present throughout most of earth's history....it is low now and has been low since the ice age that the earth is presently in because cold water holds much more CO2 than warm water does...as the water warms, it ougasses CO2.

Lets look at what passes for evidence of man made climate change in your mind...

You posted this...

It proves the temperature is rising.

And let me guess...you think that evidence that the temperature is rising is evidence that we are causing it? Are you really that stupid?

Let the data dump begin.
So you reject any information that doesn't conform to your beliefs...even when climate science itself considers the information to be gold standard...that is the best that we have? You are sounding more like a useful idiot every time you post.

What is that? The temperature of a glacier?

Better look in a mirror...your ignorance is showing. Are you really saying that you don't know what GISP2 is? Although I seriously doubt that you will be able to read and comprehend at this level, I am going to give you the National Science Foundation's description of what GISP2 is and its significance.....

"On 1 July 1993, after five years of drilling, the Greenland Ice Sheet Project Two (GISP2,) penetrated through the ice sheet and 1.55 meters into bedrock recovering an ice core 3053.44 meters in depth, the deepest ice core recovered in the world at the time. With the completion of the GISP2 drilling program and a companion European ice coring effort (the Greenland Ice core Project (GRIP), located 28 Km to the east) a new era in paleoenvironmental investigation has been opened. These records are of extreme significance to our understanding of environmental change because they not only provide the highest resolution, continuous, multi-parameter view produced thus far but as importantly the two records can be used to validate each other(e.g., dating, presence of events, length of the environmental record, presence or lack of discontinuities), the only such experiment of this magnitude in ice core research."


An estimate? What I showed was measured. It was not an estimate. I'm not interested in your data dump.

And our measurements are not even an eye blink in geological time....they aren't long enough to do anything at all with beyond create a false sense of anxiety. Once again, you reject data that even climate science accepts as the very best we can do because it doesn't support your belief...and just to highlight your ignorance, the temperature record you posted is also an estimate....the orange line represents the median between the high error bar and the low error bar....see the wide gray bar above and below the orange line?...those are the margins of error...

Since you lack even enough basic knowledge to read a simple graph, let me help you out...the graph is saying that in the past 136 years, the temperature has increased about 3/4 of a degree with a margin of error of half a degree...the margin of error is over half of the temperature increase...your graph from whoever it came from is also an estimate.

And you just like to hear yourself talk.

I can't help but note that you skipped right over all the published, peer reviewed data that contradicts your view...what's the matter pussy...is the material that far over your head?


Because of your cartoon?

No...because the US Geological survey has been studying those glaciers for a very long time and they produced the map showing the time frames of various ice losses. The graphic I provided you was no more a cartoon than the graphs of temperature and CO2 that I provided. Wouldn't expect you to grasp that being the ignoramus that you are but it is what it is.

Now this, I want to thank you for. That's more than many people would've done on this board. I don't agree you refuted it, but I am thankful you went to the trouble of trying to address the points I made.

Of course I refuted every point you made and it was child's play, because you really don't grasp what you posted...you think it means something that it doesn't...now how about you address the peer reviewed, published material that I provided in abundance that refutes every point you made...

I'm not a pussy. I'm also not an expert on climate change. So I do my research one step at a time. And so far, I'm not sold on these large modeling based explanations. I am sold on the findings of these science organizations, because it is their job to monitor and record their findings.

You don't do research....you look for opinions...you look for someone to tell you what to think...that is the difference between the 3 pictures that you posted which you clearly don't understand and the reams of peer reviewed, published research that I posted. Maybe if you actually did some research you wouldn't be playing the part of a useful idiot and simply regurgitating unsupportable opinion.

Now the problem is, you're on the same side as Trump. Who is deliberately purging scientists out of the government and replacing them with fossil fuel shills that are pushing oil and gas propaganda.

I am on the side of science, not politics which is why I support my arguments with reams of peer reviewed, published literature and you support yours with a few graphics that you don't understand but someone whose politics you agree with told you were good data.

There you go again with that bullshit doublespeak.

And there you go again not being able to articulate why you believe the few graphics you posted support the AGW hypothesis over natural variability...maybe I should ask....Do you even know what the AGW hypothesis is...or know what natural variability means? If you don't, feel free to ask.
 
This doesn't look like expansion to me.


It doesn't look current either...You are trying to prove a point about the present with data that stops in 2002?

Your graphic deliberately stops at the year with the lowest ice coverage...it started growing considerably after 2002...here is a graphic showing the change between 1992, and 2003...

greenland-ice-growth.png


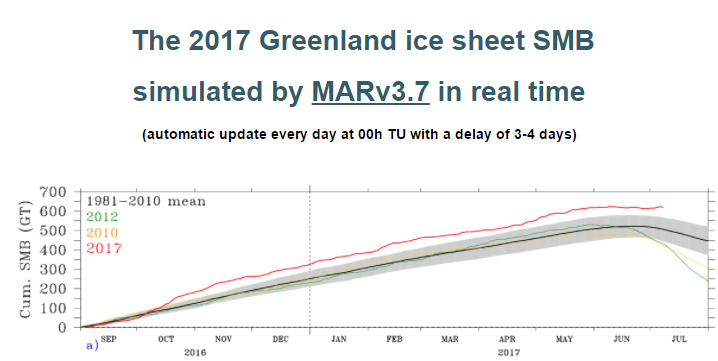
Here is a graphic showing the state of the Greenland ice sheet as of July of this year...note that the 2017 ice (red line) is considerably above the average from 1981 to 2010...that would include all of the years covered by your graphic.

2017-07-11134101.png


"...less ice..."? You do realize that less ice, means more water? And more water, means less land. And that a polar bear, is not a fish. So how the fuck, could it be easier, you hayseed-dickboy?

Using that obviously fake photo is an amateur attempt to prove a point. Again, consider this gold standard temperature reconstruction of the past 10,000 years made with data taken from ice cores collected above the Arctic circle.....Now looking at that graph, what do you suppose the arctic ice has looked like compared to today for most of the past 10,000 years...are you bright enough to read the graph and make the comparison or will you just pussy out and reject the data as I predict you will do?

Lappi_Greenland_ice_core_10000yrs.jpg


The smog in China is the result of burning fossil fuels, you dumbass. It is something you can see with the naked eye. You don't need no "model" to show you that.

Still waiting on the first piece of observed, measured, quantified data that demonstrates that burning fossil fuels results in increasing temperatures...the models predict it but the models have failed spectacularly....the pause in temperature increase is rapidly approaching 2 decades now while the atmospheric CO2 continues to rise...shouldn't the temperatures be increasing?
 
LOL

Lets burn your straw-men to the ground..

The Greenland ice shelf gained over 9 feet of thickness this year alone and in the last 10 years has expanded so greatly that calving has again started due to the weight of the new ice pushing it down the mountain. Its funny that you use a naturally occurring event that is so easily shown to be natural consequences of increasing ice. Strawman one is now ashes
This doesn't look like expansion to me.


The polar bears have increased in numbers to well over 250,000 where just 20 years ago their numbers were below 100,000. Again the warmer region and less ice have made it easier for the bears to gain food and survive... Strawman two is now ashes..
"...less ice..."? You do realize that less ice, means more water? And more water, means less land. And that a polar bear, is not a fish. So how the fuck, could it be easier, you hayseed-dickboy?


Smog in china? What the hell does that have to do with anything other that not choosing to use current technology to scrub the particulates from their stacks like we do in the states? Strawman three is now ashes...
The smog in China is the result of burning fossil fuels, you dumbass. It is something you can see with the naked eye. You don't need no "model" to show you that.

Models fail when their predictive phase fails to reproduce reality..None of your modeling has modeled reality (Observed physical-empirical evidence). Strawman 4 now ashes...
What does that mean?

"...predictive phase fails to reproduce reality..."

You wouldn't know reality if you took it rectally.

O for 4

Nice score...
That's a letter "O", not the number "0" (zero).

Maybe this subject is a little over your head? May I suggest the "bounce ball" thread would be more to your speed?
BillyO is a lying sack of excrement...

First off you use a paper that stops in 2002, (just coincidence or intentional deception?) at Greenland's lowest ice extent.. In 2017 we are above, by three standard deviations, the median 30 year trend line. this year alone we added feet of ice, not inches...

Second you totally ignore the fact that polar bears swim up to 300 miles, in the ocean, to find food. Despite the slight warming their numbers have more than doubled. Ice is not their primary home but they do use it to travel on.

Third, smog is particulate matter and causes cooling, not warming...

Forth, You don't even know how modeling is verified. Its called the predictive phase where the models output is tested against empirically observed evidence of the operating system that was modeled.. Guess what, your models are crap and your cult leaders haven't a clue how the system works and therefore cant model it. Any predictions they make are worthless.

Now pull your head from your backside and get the belly button lint out of your eyes.. Your depth is rectal implantation not science.
 
Last edited:
This doesn't look like expansion to me.


It doesn't look current either...You are trying to prove a point about the present with data that stops in 2002?

Your graphic deliberately stops at the year with the lowest ice coverage...it started growing considerably after 2002...here is a graphic showing the change between 1992, and 2003...

greenland-ice-growth.png


Here is a graphic showing the state of the Greenland ice sheet as of July of this year...note that the 2017 ice (red line) is considerably above the average from 1981 to 2010...that would include all of the years covered by your graphic.

2017-07-11134101.png


"...less ice..."? You do realize that less ice, means more water? And more water, means less land. And that a polar bear, is not a fish. So how the fuck, could it be easier, you hayseed-dickboy?

Using that obviously fake photo is an amateur attempt to prove a point. Again, consider this gold standard temperature reconstruction of the past 10,000 years made with data taken from ice cores collected above the Arctic circle.....Now looking at that graph, what do you suppose the arctic ice has looked like compared to today for most of the past 10,000 years...are you bright enough to read the graph and make the comparison or will you just pussy out and reject the data as I predict you will do?

Lappi_Greenland_ice_core_10000yrs.jpg


The smog in China is the result of burning fossil fuels, you dumbass. It is something you can see with the naked eye. You don't need no "model" to show you that.

Still waiting on the first piece of observed, measured, quantified data that demonstrates that burning fossil fuels results in increasing temperatures...the models predict it but the models have failed spectacularly....the pause in temperature increase is rapidly approaching 2 decades now while the atmospheric CO2 continues to rise...shouldn't the temperatures be increasing?
I was just about to pull the data.. Thanks for the reply with the data. BillyO is a moron.. He has been feed piles of crap and he is eating it up.
 
It doesn't look current either...You are trying to prove a point about the present with data that stops in 2002?

Your graphic deliberately stops at the year with the lowest ice coverage...it started growing considerably after 2002...here is a graphic showing the change between 1992, and 2003...

greenland-ice-growth.png


Here is a graphic showing the state of the Greenland ice sheet as of July of this year...note that the 2017 ice (red line) is considerably above the average from 1981 to 2010...that would include all of the years covered by your graphic.

2017-07-11134101.png
Well, you might have a point there. Your argument on Greenland appears to be a little more logical and relative than mine.

Using that obviously fake photo is an amateur attempt to prove a point.
Prove its fake.

Again, consider this gold standard temperature reconstruction of the past 10,000 years made with data taken from ice cores collected above the Arctic circle.....Now looking at that graph, what do you suppose the arctic ice has looked like compared to today for most of the past 10,000 years...are you bright enough to read the graph and make the comparison or will you just pussy out and reject the data as I predict you will do?

Lappi_Greenland_ice_core_10000yrs.jpg
Again, is that graph to show the temperature of a glacier going back 9925 years? And what is the blue line? The temperature of the atmosphere?


Still waiting on the first piece of observed, measured, quantified data that demonstrates that burning fossil fuels results in increasing temperatures...the models predict it but the models have failed spectacularly....the pause in temperature increase is rapidly approaching 2 decades now while the atmospheric CO2 continues to rise...shouldn't the temperatures be increasing?
Spare me your bullshit modeling mantra. Models are nothing more than a software program. And software programs can be written to achieve any outcome you want. Then you throw in all these cartoons and monster mega-answers to frame the debate into something that is impossible to discuss in a rational and relative manner.

Or maybe this conversation is a little over my head and you understand this subject a little more than I do? What I do understand, is Trump is firing scientists and deconstructing the EPA to make it more favorable to the coal and gas industry. I also understand Harvey and Irma are not normal and have occurred just a week apart.
 
I was just about to pull the data.. Thanks for the reply with the data. BillyO is a moron.. He has been feed piles of crap and he is eating it up.
Piles of crap from NASA, NOAA, etc.?

I trust their findings a lot more than I trust yours.
LOL

You cant understand what you read because you don't know science... Your so far off base it is worse than simply being wrong.
 

Forum List

Back
Top