
Trajan
conscientia mille testes
wow. 20%...lets say 15% even. tough sledding to be sure....will it?
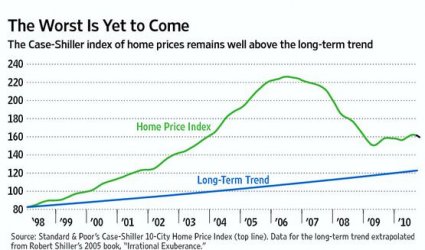
Home Prices Are Still Too High
They would have to decline another 20% just to get back to the historical trend line.
Most economists concede that a lasting general recovery is unlikely without a recovery in the housing market. A marked increase in defaults and foreclosures from today's already elevated levels could produce losses that overwhelm banks and trigger another, deeper financial crisis. Study after study has shown that defaults go up when falling prices put mortgage holders "underwater." As a result, the trajectory of home prices has tremendous economic significance.
Earlier this year market observers breathed easier when national prices stabilized. But the "robo-signing"-induced slowdown in the foreclosure market, the recent upward spike in home mortgage rates, and third quarter 2010 declines in the Standard & Poor's CaseShiller home-price indexincluding very bad October numbers reported this weekhave sparked concerns that a "double dip" in home prices is probable. A longer-term view of home price trends should sharply magnify this fear.
Even those economists worried about renewed price dips would be unlikely to believe that the vicious contractions of 2007 and 2008 (where prices fell about 30% nationally in just two years) could return. But they underestimate how distorted the market had become and how little it has since normalized.
By all accounts, the home price boom that began in January 1998, when the previous 1989 peak was finally surpassed, and topped out in June 2006 was extraordinary. The 173% gain in the Case-Shiller 10-City Index (the only monthly data metric that predates the year 2000) in those nine years averaged an eye-popping 19.2% per year. As we know now, those gains had very little to do with market fundamentals, and everything to do with distortionary government policies that mandated loans to marginal borrowers, and set off a national mania for real-estate wealth and a torrent of temporarily easy credit.
If we assume the bubble was artificial, we can instead imagine that home prices should have followed a more traditional path during that time. In stock-market terms, prices should have followed a trend line. When you do these extrapolations (see lower line in the nearby chart), a sobering picture emerges. In his book "Irrational Exuberance," Yale economist Robert Shiller (co-creator of the Case-Shiller indices along with economists Karl Case and Allan Weiss), determined that in the 100 years between 1900 and 2000, home prices in the U.S. increased an average 3.35% per year, just a tad above the average rate of inflation. This period includes the Great Depression when home prices sank significantly, but it also includes the frothy postwar years of the 1950s and '60s, as well as the strong market of the early-to-mid 1980s, and the surge in the late '90s.
more at-
Peter Schiff: Home Prices Are Still Too High - WSJ.com
Attachments
Last edited:

") I already took a 22% hit in the last 2 years and we are in a
I already took a 22% hit in the last 2 years and we are in a