ScienceRocks
Democrat all the way!
- Banned
- #21

Follow along with the video below to see how to install our site as a web app on your home screen.

Note: This feature currently requires accessing the site using the built-in Safari browser.

The short term enso isn't a big climatic factor over the long term...Just a very short one.
The pdo on the other hand is a whole new animal!
http://ingrid.ldeo.columbia.edu/(/home/alexeyk/mydata/TSsvd.in)readfile/.SST/.PDOThe "Pacific Decadal Oscillation" (PDO) is a long-lived El Niño-like pattern of Pacific climate variability. While the two climate oscillations have similar spatial climate fingerprints, they have very different behavior in time. Fisheries scientist Steven Hare coined the term "Pacific Decadal Oscillation" (PDO) in 1996 while researching connections between Alaska salmon production cycles and Pacific climate (his dissertation topic with advisor Robert Francis). Two main characteristics distinguish PDO from El Niño/Southern Oscillation (ENSO): first, 20th century PDO "events" persisted for 20-to-30 years, while typical ENSO events persisted for 6 to 18 months; second, the climatic fingerprints of the PDO are most visible in the North Pacific/North American sector, while secondary signatures exist in the tropics - the opposite is true for ENSO. Several independent studies find evidence for just two full PDO cycles in the past century: "cool" PDO regimes prevailed from 1890-1924 and again from 1947-1976, while "warm" PDO regimes dominated from 1925-1946 and from 1977 through (at least) the mid-1990's. Shoshiro Minobe has shown that 20th century PDO fluctuations were most energetic in two general periodicities, one from 15-to-25 years, and the other from 50-to-70 years.
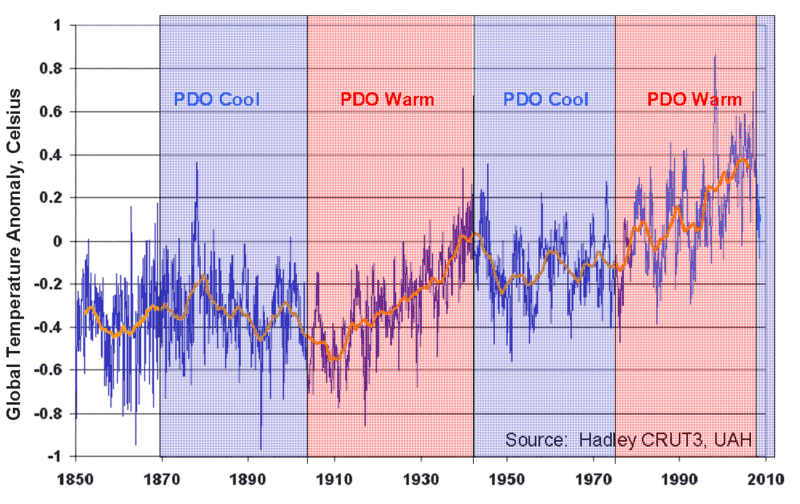
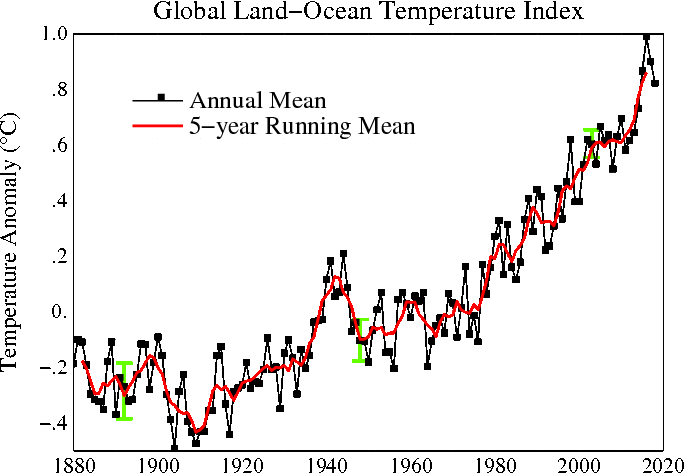
Look at any global temperature record and it follows this very closely.
1910-1940s warming
1980-2000 warming
1950-1970s stable
2000-today stable
The pdo explains the warming or stable temperature difference of the past 100 years.

The thing is the oceans @ atmosphere are both part of the system....There's only two ways to make more energy into the climatic system. 1# More solar flex, 2# green house effect. Why did they model this and say as they did??? Science is ever evolving and we're learning more....Why did people not understand how plates move across the globe 100 years ago?
This is a good solid case for the slowing of the warming...The PDO is the longer term pattern of the Pacific.
Imagine that -- natural variations SWAMPING the effects of CO2 warming.. I thought the IPCC ASSURED us that wouldn't be the case..
Imagine that -- natural variations SWAMPING the effects of CO2 warming.. I thought the IPCC ASSURED us that wouldn't be the case..
Then you thought wrong. Neither the IPCC nor any climate scientist has ever assured that wouldn't be the case. How many times have you see the graph of radiative forcing factors - the vertical bar graph? Is CO2 alone there? No. So unless you've got something a little more germane to bring to the discussion, stick a cork in it.

The Pacific getting cooler in response to AGW makes it sound as if the earth is a living organism
The Pacific getting cooler in response to AGW makes it sound as if the earth is a living organism
It's Gaia man......Gaia I tell you!!!!!
Imagine that -- natural variations SWAMPING the effects of CO2 warming.. I thought the IPCC ASSURED us that wouldn't be the case..
Then you thought wrong. Neither the IPCC nor any climate scientist has ever assured that wouldn't be the case. How many times have you see the graph of radiative forcing factors - the vertical bar graph? Is CO2 alone there? No. So unless you've got something a little more germane to bring to the discussion, stick a cork in it.
As ususal, you are wrong. Here is the graph from the ipcc giving climate science's breakdown of radiative forcing. Clearly they believe that human influences overwhelm natural influences by a wide margin.
It's hard to tell if you're being deliberately deceptive or you're just too stupid and ignorant about science to recognize your mistake. The chart you posted is only tracking "radiative forcings", not the other natural factors that can influence the climate, like the ENSO or PDO cycles. Too bad you're too ignorant and clueless to comprehend the difference, SSoooDDuuuumb.
Radiative forcing
From Wikipedia, the free encyclopedia
In climate science, radiative forcing is defined as the difference between radiant energy received by the earth and energy radiated back to space. Typically, radiative forcing is quantified at the tropopause in units of watts per square meter of earth's surface. A positive forcing (more incoming energy) warms the system, while negative forcing (more outgoing energy) cools it. Causes of radiative forcing include changes in insolation (incident solar radiation) and in concentrations of radiatively active gases and aerosols.
Then you thought wrong. Neither the IPCC nor any climate scientist has ever assured that wouldn't be the case. How many times have you see the graph of radiative forcing factors - the vertical bar graph? Is CO2 alone there? No. So unless you've got something a little more germane to bring to the discussion, stick a cork in it.
As ususal, you are wrong. Here is the graph from the ipcc giving climate science's breakdown of radiative forcing. Clearly they believe that human influences overwhelm natural influences by a wide margin.

HEY ABRAHAM -- you nano-witted eco-dupe... WHERE IS IT?? You see a whole pile of NATURAL cyclical forcings in there??? You see any OCEAN forcings in there? Any OCEAN storage?
NO -- just doing their job to account for all the MAN-CAUSED warming.. You're never gonna get that --- are ya???
The sacred chart is CRAP !!!!
As ususal, you are wrong. Here is the graph from the ipcc giving climate science's breakdown of radiative forcing. Clearly they believe that human influences overwhelm natural influences by a wide margin.

HEY ABRAHAM -- you nano-witted eco-dupe... WHERE IS IT?? You see a whole pile of NATURAL cyclical forcings in there??? You see any OCEAN forcings in there? Any OCEAN storage?
NO -- just doing their job to account for all the MAN-CAUSED warming.. You're never gonna get that --- are ya???
The sacred chart is CRAP !!!!
Your brain is CRAP, fecalhead!!!!
And another dumbass denier cult dingbat pops up who also can't comprehend the meaning of "radiative forcing", or how it differs from the other natural factors that influence heat distribution within the Earth system.
The Earth is taking in more energy than it is radiating away into space and that's an observed and measurable fact. Natural factors like the ENSO and PDO cycles influence how the excess solar energy is distributed to the atmosphere and oceans but they do not change the fact that the Earth is still warming up.


