Global Warming and the Null Hypothesis...

While I disagree with the term Frank used he definitely has a grasp of science and the current delema that pseudo scientists and corrupted journals have created. Unlike some others who refuse to assess their own short sightedness.

Name a journal you believe to have corrupted the process, incidences of such corruption and your evidence for believing so. You might also identify pseudo scientists you find my side of this argument to be using.

The better question is which ones are not corrupt. Simply put, that list is very short.

Can't name a journal. Can't name a pseudo-scientist. Got it.
 
Regarding CO2;

The hypothesis is formed from a closed cylinder containing Argon gas and CO2 in varying concentrations. (argon does no interfere with down-welling high frequency solar radiation) They then passed sun light through the cylinder and measured the reflected amount of heat returning to the green surface below the cylinder. ( they measured original pass then placed the green screen and measured the heat reflection.) it resulted in this graph:

View attachment 31627

The problem comes when they take this graph and apply it in a non-linear atmosphere. Water vapor can render the gases traits null. when you consider that the gas can reflect high frequency energy it should cause some warming. The flip side of this coin is Black Body or long wave IR radiation. CO2 thins the water vapor so at night LWIR escapes easily in higher concentrations.

The offset is almost a 1-1 ratio. But then we add clouds, wind, oceans, etc and that warming effect is essentially gone.

The hypothesis is formed in the lab but in the functioning ecosystem of earth it is laid irrelevant. As I showed in the second post of this thread there is no coupling of temperature rise with CO2 levels. CO2 always lags temp by 200 years or so. We will be well into a cooling cycle before CO2 drops significantly.

IF you follow the X and Y axis notations you will see Degrees of temp rise Vs. Level of CO2 in PPM. From about O ppm to 270 ppm is 90% of the heat reflecting capability of this trace gas. above 270 to our current level of 398ppm we see just 0.4 deg C of potential warming. From our point today out to above 1000ppm we will see roughly 0.4 deg C potential from this trace gas.

The so called Sensitivity is how water vapor responds to this trace gas and as empirical evidence has shown, they are decoupled and may even be a Negative factor allowing greater cooling at the poles due to extended darkness. Just the opposite of what the alarmists have been stating.


Hey.. @skookerasbil --- THERE IS YOUR EXPERIMENT THAT YOUVE BEEN DEMANDING.. Not the kind of result that will fry the planet anytime soon..

This is one point I wanted to expand on as we have identified trends in UV/Visible/IR wave length intensity. This is important as a shift in intensity from one wave length (or band) to another can significantly change the earths energy budget. When the earth no longer receives the intensity in a band which creates heat the energy budget changes.

We have been looking for a trigger which operated totally outside of CO2/GHG influence as geological history tells us that glaciation has occurred many times with high levels of CO2. What is it that can totally ignore earths gases, vapors, and their presence?

The Sun.

CO2 IR Wave Passage.JPG


When we look at the spectrum of energy transfer we see how the major one around 1um has certain areas where water vapor totally scatters or absorbs the down welling radiation. What we are observing is a shift from 0.1um to 1.2um wave lengths (left side of graph is high frequency, to long wave low frequency on the right) Its a minor shift in the suns output but the earths atmosphere then blocks, scatters, or absorbs the energy in the areas of these increasing in intensity wavelengths.

Energy budget change. When it was higher frequency it was in an area that had little interference with earths atmosphere. Now that energy has moved to areas where earths gases and water vapor diminish the ground registered W/m^2 in those respective wavelengths. Total TSI remains unchanged but the effect at ground level and lower troposphere has changed. It is only about a total of 1.4 W/M^2 but significant enough to change the Arctic and Antarctic weather patterns. It has also increased cloud cover globally centered in forests and green foliage jungle areas by warming and water evaporation which in turn reflects day time input.

This kind of simple shift can undoubtedly cause glaciation irrespective of CO2 levels and it is an area we are just beginning to understand.
 
While I disagree with the term Frank used he definitely has a grasp of science and the current delema that pseudo scientists and corrupted journals have created. Unlike some others who refuse to assess their own short sightedness.

Name a journal you believe to have corrupted the process, incidences of such corruption and your evidence for believing so. You might also identify pseudo scientists you find my side of this argument to be using.

The better question is which ones are not corrupt. Simply put, that list is very short.

Can't name a journal. Can't name a pseudo-scientist. Got it.

The Journal of nature is on of the worst ones... Its silent retraction rate is funny...
 
Regarding CO2;

The hypothesis is formed from a closed cylinder containing Argon gas and CO2 in varying concentrations. (argon does no interfere with down-welling high frequency solar radiation) They then passed sun light through the cylinder and measured the reflected amount of heat returning to the green surface below the cylinder. ( they measured original pass then placed the green screen and measured the heat reflection.) it resulted in this graph:

View attachment 31627

The problem comes when they take this graph and apply it in a non-linear atmosphere. Water vapor can render the gases traits null. when you consider that the gas can reflect high frequency energy it should cause some warming. The flip side of this coin is Black Body or long wave IR radiation. CO2 thins the water vapor so at night LWIR escapes easily in higher concentrations.

The offset is almost a 1-1 ratio. But then we add clouds, wind, oceans, etc and that warming effect is essentially gone.

The hypothesis is formed in the lab but in the functioning ecosystem of earth it is laid irrelevant. As I showed in the second post of this thread there is no coupling of temperature rise with CO2 levels. CO2 always lags temp by 200 years or so. We will be well into a cooling cycle before CO2 drops significantly.

IF you follow the X and Y axis notations you will see Degrees of temp rise Vs. Level of CO2 in PPM. From about O ppm to 270 ppm is 90% of the heat reflecting capability of this trace gas. above 270 to our current level of 398ppm we see just 0.4 deg C of potential warming. From our point today out to above 1000ppm we will see roughly 0.4 deg C potential from this trace gas.

The so called Sensitivity is how water vapor responds to this trace gas and as empirical evidence has shown, they are decoupled and may even be a Negative factor allowing greater cooling at the poles due to extended darkness. Just the opposite of what the alarmists have been stating.


Hey.. @skookerasbil --- THERE IS YOUR EXPERIMENT THAT YOUVE BEEN DEMANDING.. Not the kind of result that will fry the planet anytime soon..

This is one point I wanted to expand on as we have identified trends in UV/Visible/IR wave length intensity. This is important as a shift in intensity from one wave length (or band) to another can significantly change the earths energy budget. When the earth no longer receives the intensity in a band which creates heat the energy budget changes.

We have been looking for a trigger which operated totally outside of CO2/GHG influence as geological history tells us that glaciation has occurred many times with high levels of CO2. What is it that can totally ignore earths gases, vapors, and their presence?

The Sun.

View attachment 31629

When we look at the spectrum of energy transfer we see how the major one around 1um has certain areas where water vapor totally scatters or absorbs the down welling radiation. What we are observing is a shift from 0.1um to 1.2um wave lengths (left side of graph is high frequency, to long wave low frequency on the right) Its a minor shift in the suns output but the earths atmosphere then blocks, scatters, or absorbs the energy in the areas of these increasing in intensity wavelengths.

Energy budget change. When it was higher frequency it was in an area that had little interference with earths atmosphere. Now that energy has moved to areas where earths gases and water vapor diminish the ground registered W/m^2 in those respective wavelengths. Total TSI remains unchanged but the effect at ground level and lower troposphere has changed. It is only about a total of 1.4 W/M^2 but significant enough to change the Arctic and Antarctic weather patterns. It has also increased cloud cover globally centered in forests and green foliage jungle areas by warming and water evaporation which in turn reflects day time input.

This kind of simple shift can undoubtedly cause glaciation irrespective of CO2 levels and it is an area we are just beginning to understand.

Excellent.. What platform is measuring these shifts? And how many "real-time" solar spectrometers are actually currently useful?

We need at LEAST 40 years of satellite observation to even BEGIN to make guesses on what color the sun is today.. And the GWarmers will be retired by the time the results come in..

There are five terrestrial satellites that I am aware of and four of them are active. As for ground based assessment points, we have 25. Its not enough as were doing preliminary work for a much bigger assessment. There is only about 4 years of data and we will need about 4 more before I write it up.

The major shift was three years ago just before Antarctica began its rapid shift to ice build up. The sun has not shifted back as of today's readings but we are seeing a further shift to longer waves indicating a slight cooling of the suns convection layers. Not having a historical record of how long these shifts last, it could be a very long and cold time before it returns to what we have been seeing in recent history or it could be a simple short term cycle of the sun's internal dynamo. We simply dont have enough information at this time. Is it the 60 year cycle or is it a longer term? What we do know is were in the 60 year cooling side of the natural cycle, from the sinodal pattern. Beyond that we dont have enough information.
 
Last edited:
"Open science" = NO PEER REVIEW

Center for Study of Carbon Dioxide and Global Change = front group created by the Idso's, employs industry lobbyist Robert Ferguson and is funded solely by Exxon and the Scaife Foundation.

Complete crap.
Isn't PAL review grand.. Peer review has been corrupted and holds no credibility these days. Most credible Scientists use Bloggs, closed access discussions, and post all of their work/data for fellow scientific discussion. Climategate revealed how the Journals have been controlled and corrupted. Real scientists are finding ways to continue their craft openly with credibility.

The current incestuous relationship of Government, Journals, and Universities has made it a circle of pals. Grants are controlled by the journals who publish work, Universities get grants from government seeking a certain outcome, The PHD's Of universities are the ones controlling who gets published with input from the Dept Of Ed.

If your not following the agenda you dont get published, you dont get grants, and you dont get promoted in the learning environment... Gobbell's would be proud of this propaganda and indoctrination machine that liberals have built...... ITS BROKEN!

More insane and thoroughly debunked denier cult myths and crackpot conspiracy theories, as usual from ol' BoobyBobNutJob.

Only bamboozled denier cult retards are still deluded enough to think that so-called 'climategate' was anything but a phony 'scandal' cooked up by the fossil fuel industry propagandists.

Debunking Misinformation About Stolen Climate Emails in the "Climategate" Manufactured Controversy
Union of Concerned Scientists
8/25/11
The manufactured controversy over emails stolen from the University of East Anglia's Climatic Research Unit has generated a lot more heat than light. The email content being quoted does not indicate that climate data and research have been compromised. Most importantly, nothing in the content of these stolen emails has any impact on our overall understanding that human activities are driving dangerous levels of global warming. Media reports and contrarian claims that they do are inaccurate.

Shortened. You can only post an excerpt of an article, not the entire thing. - Taz
 
Last edited by a moderator:
Before YOU write it up?

Give us a fooking break.
That thing Scientists do when their studies are at an end or they request further grant monies to further study a problem.. I know the scientific method is foreign to liberals but do try to use your brain. Just this once. :smoke:
 
Excellent.. What platform is measuring these shifts? And how many "real-time" solar spectrometers are actually currently useful?

We need at LEAST 40 years of satellite observation to even BEGIN to make guesses on what color the sun is today.. And the GWarmers will be retired by the time the results come in..

There are five terrestrial satellites that I am aware of and four of them are active. As for ground based assessment points, we have 25. Its not enough as were doing preliminary work for a much bigger assessment. There is only about 4 years of data and we will need about 4 more before I write it up.

The major shift was three years ago just before Antarctica began its rapid shift to ice build up. The sun has not shifted back as of today's readings but we are seeing a further shift to longer waves indicating a slight cooling of the suns convection layers. Not having a historical record of how long these shifts last, it could be a very long and cold time before it returns to what we have been seeing in recent history or it could be a simple short term cycle of the sun's internal dynamo. We simply dont have enough information at this time. Is it the 60 year cycle or is it a longer term? What we do know is were in the 60 year cooling side of the natural cycle, from the sinodal pattern. Beyond that we dont have enough information.

I only know of a couple spectrometer pkgs on sats that do wideband visible/IR/UV measurements and ONE may be defunct.. Part of the problem for this inquiry -- is that all the time and money is on high energy spectrometry for solar flares and solar surface effects and NOT Earth climate energy studies.

Money and attention need to be grabbed so that FUNDAMENTAL understandings of solar instabilities are studied..
 
More insane and thoroughly debunked denier cult myths and crackpot conspiracy theories, as usual from ol' BoobyBobNutJob.

Only bamboozled denier cult retards are still deluded enough to think that so-called 'climategate' was anything but a phony 'scandal' cooked up by the fossil fuel industry propagandists.

<snip - Fiar use of Copyrighted material>

One. The Emails were in a file that was collected due to demands of a court for Freedom Of Information Law violation in Britain.

Two. That file was placed on a public server with public access.

Three. It was found by out side sources and copied, the university warned and the contents released as it was on a PUBLIC SERVER.

There was no theft involved.
There was no privacy considerations involved..

You guys really need to get your facts straight!

And your inability to use civil discourse and name calling is noted.. This usually is a signal that you give up and concede but do not have the fortitude to do so..
 
Last edited:
I only know of a couple spectrometer pkgs on sats that do wideband visible/IR/UV measurements and ONE may be defunct.. Part of the problem for this inquiry -- is that all the time and money is on high energy spectrometry for solar flares and solar surface effects and NOT Earth climate energy studies.

Money and attention need to be grabbed so that FUNDAMENTAL understandings of solar instabilities are studied..

I understand the use for solar flares and the damage to our communications and electrical infrastructure they can cause. I do not fault them for that but they simply have ignored how the earth receives its energy from the sun. We simply do not fully understand all the little nuances which can have devastating effects.

The Two NOAA/NWS satellites and one French are full spectrum. One NASA and one Chinese are limited spectral. Its one of the NOAA satellites that has a problem and it has always been a head ache. There are other private platforms that we have been unable to get access to.
 
The Null Hypothesis states " a system can nullify a hypothesis by simple addition of items or removal of items, one at a time, and observing the reactions of the system to that change."

The last 17 years and 11 Months of no warming while CO2 has steadily increased is the ultimate show of this process. CO2 has been added but no offsetting Temperature increase has been seen.

The Null Hypothesis has rendered the CO2 boogie man a straw man and irrelevant.


This is just the beginning of the problems with Anthropogenic Global Warming. Mother Nature has shown the premise false all by herself and now we wait for the next thirty years during a cooling cycle as the temperature drops predictably.
Don 't hold your breath as we have not had a cooling cycle where temperature drops significantly in 100 years. It seems like these flat cycles, like we are in now and are about half way through, have replaced the natural cooling cycles. Time will tell which of us is correct.

I would generally agree, However, the solar cycles of 3, 4, 5 are mirror images of 22, 23, 24. Those earlier ones were prior to the beginning of the Little Ice Age. The Planetary positions are very similar and precision is almost identical in our elongated cycle. The ADO, PDO, ENSO, and other circulations have all gone cold. We have been cooling now since 2002 and have dropped -0.38 Deg C (according to the CRN data network)

At this point all bets are off. The failed El Nino this year means we will not see one again for at least two years and by that time massive cooling can be set in.

I just do not see anything warm coming for some time. My question is, will it be a Dalton or Maunder event? IMHO
 
I wish I could claim this work but I can not. It is a culmination of papers I have read and presentations I have seen or been a part of. Several persons and institutions are included in the presentation of the material below. I apologize in advance if I miss attribution to specific individuals. I will make every attempt to properly attribute sources.

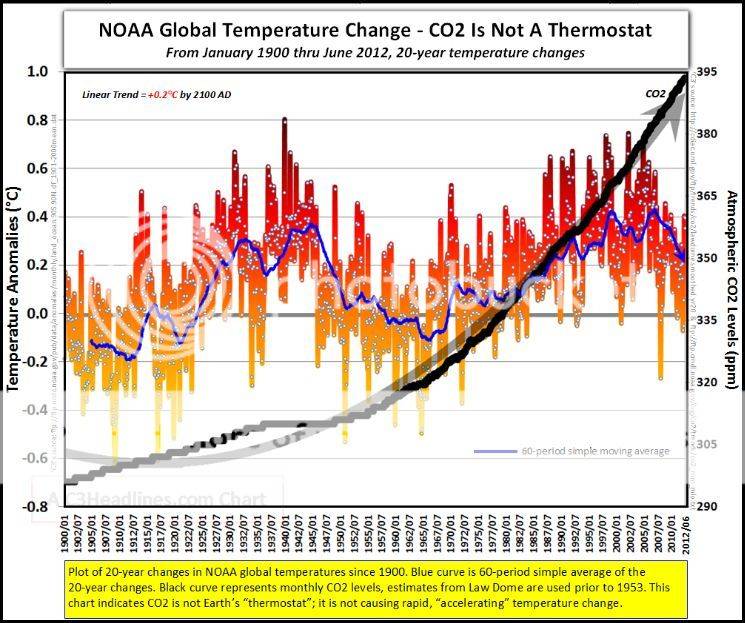
Below are two rates of warming from the Hadcrut3 lower troposphere. One is from the period 1900 through 1950 and the the other is 1951 through 2000. Below each is the rate of warming.

trend


The trend for the period 1900-1950 is 0.51 deg C or 0.103/decade

This trend occurred before CO2 became a rapidly increasing according to the IPCC and is near or is the Natural Variational rate.

The trend for 1951-2000 is 0.50 deg C or 0.100 deg C/decade.

Now wait... this means that the two rates of warming are statistically insignificant DESPITE the rapid rise in CO2 and equal to NATURAL VARIATION..

GlobaltempChange.jpg


Source;Midtroposheric Warming-Dr.J Christy

So by simple observation we can see the problem with the hypothesis of runaway temp caused by CO2. During the time they claim runway rise it was nothing of the sort and even given the rise in CO2 there was no discernible increase in that natural rise. In other words Natural Variation IS the cause of both rates of warming. The problem alarmist have now is determining what man is supposed to be responsible for.

Welcome to the forum -- I see you've met the peanut gallery. We gotz to tred lightly here with the Christy interpretation above. Mostly because of the juvenile level of discussion that our "warmer bench" understands.

What Christy did was to present the "trend" or derivative of the temperature record using 20 year intervals. Here's where I need more.
What Christy and his partner in crime Spencer at UAH did was, after being caught fudging the data to turn global warming in the LOWER TROPOSPHERE into global cooling, switch to the MID TROPOSPHERE because he knew that deniers would see the kind of graph they want to see and ignore the fact we live on the SURFACE of the globe and not in the mid troposphere.
 
The Null Hypothesis states " a system can nullify a hypothesis by simple addition of items or removal of items, one at a time, and observing the reactions of the system to that change."

The last 17 years and 11 Months of no warming while CO2 has steadily increased is the ultimate show of this process. CO2 has been added but no offsetting Temperature increase has been seen.

The Null Hypothesis has rendered the CO2 boogie man a straw man and irrelevant.


This is just the beginning of the problems with Anthropogenic Global Warming. Mother Nature has shown the premise false all by herself and now we wait for the next thirty years during a cooling cycle as the temperature drops predictably.
Don 't hold your breath as we have not had a cooling cycle where temperature drops significantly in 100 years. It seems like these flat cycles, like we are in now and are about half way through, have replaced the natural cooling cycles. Time will tell which of us is correct.

I would generally agree, However, the solar cycles of 3, 4, 5 are mirror images of 22, 23, 24. Those earlier ones were prior to the beginning of the Little Ice Age. The Planetary positions are very similar and precision is almost identical in our elongated cycle. The ADO, PDO, ENSO, and other circulations have all gone cold. We have been cooling now since 2002 and have dropped -0.38 Deg C (according to the CRN data network)

At this point all bets are off. The failed El Nino this year means we will not see one again for at least two years and by that time massive cooling can be set in.

I just do not see anything warm coming for some time. My question is, will it be a Dalton or Maunder event? IMHO
According to NOAA the trend from 2002 to 2014 has been +.06 C/decade.
We haven't cooled for 100 years and it is likely this flat trend will continue the next 2 years that you expect cooling.

Climate at a Glance National Climatic Data Center NCDC
 
We haven't cooled for 100 years and it is likely this flat trend will continue the next 2 years that you expect cooling.

Climate at a Glance National Climatic Data Center NCDC

Ah Yes the ADJUSTED data.. I knew this would come up too,

The National Oceanic and Atmospheric Administration’s most accurate, up-to-date temperature data confirm the United States has been cooling for at least the past decade. The NOAA temperature data are driving a stake through the heart of alarmists claiming accelerating global warming.

Responding to widespread criticism that its temperature station readings were corrupted by poor siting issues and suspect adjustments, NOAA established a network of 114 pristinely sited temperature stations spread out fairly uniformly throughout the United States. Because the network, known as the U.S. Climate Reference Network (USCRN), is so uniformly and pristinely situated, the temperature data require no adjustments to provide an accurate nationwide temperature record.
Further down in the article:
According to the USCRN temperature readings, U.S. temperatures are not rising at all – at least not since the network became operational 10 years ago. Instead, the United States has cooled by approximately 0.4 degrees Celsius, which is more than half of the claimed global warming of the twentieth century.

Source

Poor siting of the old network and adjustments up the wazoo... Along with Urban Heat islands affecting stations.
 
Last edited:
What Christy and his partner in crime Spencer at UAH did was, after being caught fudging the data to turn global warming in the LOWER TROPOSPHERE into global cooling, switch to the MID TROPOSPHERE because he knew that deniers would see the kind of graph they want to see and ignore the fact we live on the SURFACE of the globe and not in the mid troposphere.

Too Funny;

Alarmist moving the goal posts. What Christy did was show the Trenbreth hot spot was not only a lie but had no basis in reality. One of the major points of the CAGW movement is the Mid Tropospheric warming. Without it the theroy falls dead.. Guess what isn't happening...
 
I'm thinking of changing my board name to Odie Ray. It's more humble and has better camo-value with leftists. Whatcha think Billie Bob?? Lower tropo measurements ARE the surface. And Christy and Spencer NEVER fudged any data. They did discover a small sat correction error in their data processing, but thats why they get a paycheck. UAH data has since been largely in agreement with surface data.

As far as the rate calculations above, MID tropo was probably chosen for more homogeneity of CO2 and to fend off criticism of water vapor domination and surface CO2 saturation effects. There BETTER be a discoverable warm rate at Mid tropo ---- Right Ed the Cynical??????
:beer:
Nice catch... :biggrin:

By the way Odie is my hero! Odie.JPG
 
Last edited:

Forum List

Back
Top