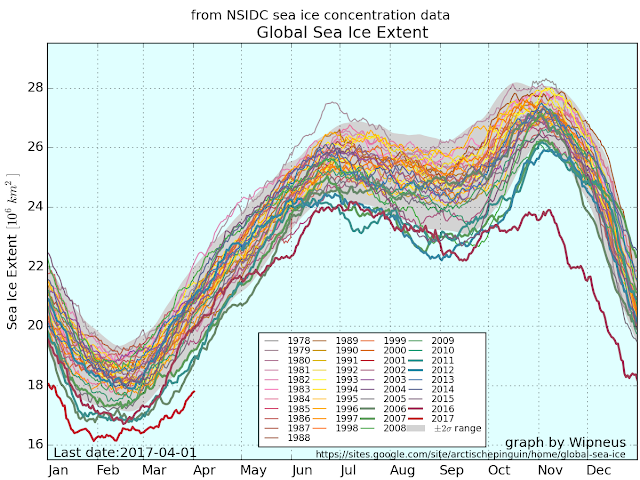
Could you explain the logical reasoning that you used to come to that conclusion?The amount of sea ice continues to be well below any previous record since we started measuring it by satellite.
Or, are you afraid that I will rip it to shreds shove up your brainwashed ass?
Or what?
Put up or shut up, jackass.
Last edited: