Climate Scientist Warns Sea Levels Are Rising Faster Than We Thought

Global ice is melting worldwide at the caps, ask any polar bear. So, subsequently, sea levels will rise, its not too difficult a subject a grasp. I don't understand where the resistance to this comes from. But, proceed to educate me I'm sure.
 
Global ice is melting worldwide at the caps, ask any polar bear. So, subsequently, sea levels will rise, its not too difficult a subject a grasp. I don't understand where the resistance to this comes from. But, proceed to educate me I'm sure.


Antarctic ice is at record levels. Arctic ice is within the 20 year standard deviation. In other words you are flat wrong.
 
The only parameter that's increasing is the extent of the Antarctic ice shelves. The cause of that is the collapse of existing shelves allowing ice to slide off the continent at a rate more than five times higher than it was only a few decades past. Mass loss from the continent, THE parameter of interest in all of this, is up. The WAIS is crumbling into the sea and will raise sea levels 3.2m all by itself. The best estimates of mass loss from the continent as a whole, from glacial flow and melt, is ~80 billions tons per year, This does NOT count dynamic changes such as the disintegration of the WAIS. Antarctic Ice Sheet surface mass balance
 
Global ice is melting worldwide at the caps, ask any polar bear. So, subsequently, sea levels will rise, its not too difficult a subject a grasp. I don't understand where the resistance to this comes from. But, proceed to educate me I'm sure.


You folks kill me, Tell us the story of the Akademik Shokalskiy.

MV Zue Long and Snow Dragon ............. you know ice breakers stuck in a frozen sea for how long??


According to the National Snow and Ice Data Center (NSIDC), the Northern Hemisphere sea ice extent — which is measured from passive microwave instruments onboard NOAA satellites — averaged for June 2015 was 10.97 million square km (4.24 million square miles), 920,000 square km (350,000 square miles), or 7.74 percent, below the 1981-2010 average. This was the third smallest June Arctic sea ice extent on record, slightly larger than the June sea ice extents of 2010 and 2012. The rate of sea ice loss was near average for June, with ice loss accelerating towards the end of the month. Sea ice extent was below average across the Barents and Chukchi Seas and across western parts of Hudson Bay. Above-average sea ice was observed across eastern parts of Hudson Bay and near-average sea ice was observed to the east of Greenland. For the month of June, the Arctic sea ice extent is decreasing at an average rate of 3.5 percent per decade.


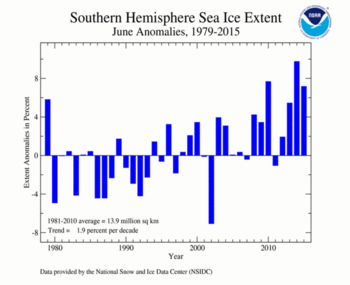
June's Southern Hemisphere
Sea Ice Extent plot

The June 2015 Southern Hemisphere sea ice extent was 14.93 million square km (5.76 million square miles), 1.00 million square km (380,000 square miles), or 7.18 percent, above the 1981-2010 average. This was the third largest Antarctic sea ice extent on record, only smaller than the June sea ice extents of 2010 and 2014. There was slightly above-average sea ice in every region of the Antarctic, with much-above average ice in the eastern Waddell and Ross Seas. June 2015 is the fourth consecutive June with above-average sea ice extent in the Southern Hemisphere. June also marks the end of a two-consecutive month stretch (April and May 2015) of record large sea ice in the Antarctic, due to the ice growth slowing in some regions during the month. June Antarctic sea ice extent is increasing at an average rate of 1.8 percent.

When combining the Northern Hemisphere and Southern Hemisphere sea ice extents, the globally-averaged sea ice extent during June was 25.90 million square km (10.00 million square miles), 0.35 percent above the 1981-2010 average and the 14th largest June global sea ice extent on record. Global sea ice extent during June has been above average for the past three years, despite the decreasing global sea ice trend of 0.62 percent per decade over the 37-year period of record.
Global Snow Ice - June 2015 National Centers for Environmental Information NCEI

Concerning the rise in sea levels, there is not a fluctuation of sea levels that is provable based on sediment data.

Are you claiming all ocean levels are rising at the same rate??

So if there is difference in rate, things such as tectonic plate geometry of the basin or sedimentation deposits from natural erosion, yada, yada are not part of the equation that needs to be contemplated??

Where is that correlation between one and the other??

What scientific evidence do you have to support your assertion??
 
Posted on January 25, 2015 by John Hinderaker in Climate
2014 Was One of the 3% Coldest Years in the Last 10,000
Climate alarmists play a number of tricks to try to make their catastrophic anthropogenic global warming theory seem plausible. One of the most important is that they focus on a ridiculously short period of time, beginning either in the late 19th century or at the beginning of the 20th. This is, of course, not even the blink of an eye in geologic time. Given that the Earth began emerging from the Little Ice Age in the mid to late 19th Century, it is hardly surprising–and a very good thing–that from then until now, temperatures have tended to rise.

Alarmists shriek that 2014 was the warmest year ever! But that claim is absurd if put in the context of the Earth’s recent history. As Dr. Tim Ball writes:

In fact, 2014 was among the coldest 3 percent of years of the last 10,000, but that doesn’t suit the political agenda.

This chart shows Northern Hemisphere temperature changes over the last 10,000 years, based on ice core data. Dr. Ball explains: “The red line, added to the original diagram, imposes the approximate 20th century temperatures (right side) against those of the last 10,000 years.”

clip_image0211.jpg


If the Earth continues to be warm, temperatures will be more nearly aligned with what they have generally been over the last 10,000 years.

2014 Was One of the 3 Coldest Years in the Last 10 000 Power Line


Yep......the fuckery they peddle is just so ghey.
 
Judging by the posts of the deniers on this thread, denialism has surpassed "alien abduction cults" in the rankings of "most detached from reality." They should consider the advantages of formally merging their denier cult with the alien abduction cult. If they did, they could start blaming the warming on aliens, and also blame their own increasingly erratic behavior on the probings.

Now, did this thread have a topic before the conspiracy cultists began barking at the moon? Oh yes, sea level rise.

Here's yet another reason we know mainstream science has the sea level record correct. Ancient eclipses.

Ancient astronomers were very good, and kept excellent records. They timed to within a few minutes of error.

Right now, we can calculate when those eclipses would have happened, down to the second.

So, by comparing the calculations with ancient observations, we can determine how much the earth's rotation has slowed down over the centuries.

Two things change the rate of earth's rotation. Tidal friction slows it down at a constant rate, and sea level changes can increase or decrease it. Rising sea levels move mass from the poles towards the equator and slow down the earth. So, the ancient eclipses can be used to determine the amount of sea level rise over the centuries.

And ... zango bango ... those calculations agree with the other sea level proxy measurements.

That's the beauty of global warming science, and why it has such credibility. It's always gets confirmed across multiple independent disciplines.
 
Judging by the posts of the deniers on this thread, denialism has surpassed "alien abduction cults" in the rankings of "most detached from reality." They should consider the advantages of formally merging their denier cult with the alien abduction cult. If they did, they could start blaming the warming on aliens, and also blame their own increasingly erratic behavior on the probings.

Now, did this thread have a topic before the conspiracy cultists began barking at the moon? Oh yes, sea level rise.

Here's yet another reason we know mainstream science has the sea level record correct. Ancient eclipses.

Ancient astronomers were very good, and kept excellent records. They timed to within a few minutes of error.

Right now, we can calculate when those eclipses would have happened, down to the second.

So, by comparing the calculations with ancient observations, we can determine how much the earth's rotation has slowed down over the centuries.

So now we want to claim eclipses are responsible for what??

Two things change the rate of earth's rotation. Tidal friction slows it down at a constant rate, and sea level changes can increase or decrease it. Rising sea levels move mass from the poles towards the equator and slow down the earth. So, the ancient eclipses can be used to determine the amount of sea level rise over the centuries.

First of all you do realize that the rotation of the earth is tied to our calendar year??

By stating that the rate of the earths rotation has changed would suggest that all modern astrological rules and laws do not apply.

So how much time have we gained or lost by this change in rotation and did we increase rotational speed or loose rotational speed??

So you reckon that rising sea levels move mass( I presume you are referring to ice / snow) from the poles to the equators huH??

So what about all those circular ocean currents that would not let that occur??

So ancient eclipses can be used to determine sea level rise over the centuries, what is the point in this statement??

Are you asserting the oceans have been rising for centuries without falling??

Scientific data seems to call you an ignorant liar.


And ... zango bango ... those calculations agree with the other sea level proxy measurements.

That's the beauty of global warming science, and why it has such credibility. It's always gets confirmed across multiple independent disciplines.

So you have lies piled on top of lies and you claim credibility ................

Fucking hilarious, ignorant, delusional, shame less ..............

Where is that confirmation again for this shit, you know one of those linky thingy's??

The only thing confirmed is you are a really bad shucker and jiver ............
 
Just when you think you have seen the most ignorance in the deniers, someone like our good Dr. comes along. Sea level rise is something that is very well recorded in a number of ways. Mamooth outlined some of them.

Given Frank's hollow moon, I think that is already the case. Given some of the hypothesis presented on photons and radiation by our deniars, I think their abductions definately affected their mental capacities.
 
Doom is right here, Frank couldn't carry water in this conversation and hasn't been able to prove his IQ is out of the single digits yet!

Go ahead and trot your little moronic pony out ....................

I see you hiding like a little bitch right now LikesToSuckOldCocks .......................

You were going to show me some kind of correlation between sea levels rising and global warning maybe??

If you could only prove global warming then you could base that lie on another lie, but you can't.

It is cut and dry that simple.

Don't come out here and spew shit on everyone about what you have done or are capable of doing.

Show me mouthy bitch ..................
 
Observations Oceanic Climate Change and Sea Level - Library Open Repository

LIBRARY OPEN REPOSITORY

Observations: Oceanic Climate Change and Sea Level


Abstract

The oceans are warming. Over the period 1961 to 2003, global ocean temperature has risen by 0.10°C from the surface to a depth of 700 m. Consistent with the Third Assessment Report (TAR), global ocean heat content (0– 3,000 m) has increased during the same period, equivalent to absorbing energy at a rate of 0.21 ± 0.04 W m–2 globally averaged over the Earth’s surface. Two-thirds of this energy is absorbed between the surface and a depth of 700 m. Global ocean heat content observations show considerable interannual and inter-decadal variability superimposed on the longer-term trend. Relative to 1961 to 2003, the period 1993 to 2003 has high rates of warming but since 2003 there has been some cooling.

http://www.epa-pictaural.com/ctr/m/cc/transcript/stocker.pdf

Climate Change 2013: The Physical Science Basis

And if you now take this physical based look on global change, an energy
based look, you could argue the most fundamental way how to look at climate
change, this change is very obvious. The ocean is recording and storing that
information for us, the ocean water can, due to its heat capacity, take up a lot
of heat, and that can be measured very precisely, looking at temperature.
And isn’t it paradoxical? We are always fixated on measuring the
temperatures at the surface of the earth, admittedly an important parameter.
But in terms of energy it’s simply not relevant as you see in this graph. The
accumulation of energy in the climate system amounts to 70m twh over the
past 40 years. And this is a huge number, and I will just give you one other
number. It’s 500 times more than the world’s energy consumption in one
year. This accumulation is caused by the increase of greenhouse gas
concentrations in the atmosphere.
And here I show a figure that has been measured at our institute, asking
Antarctic ice cores as to the concentration of carbon dioxide over the past
800,000 years. This is a record that you see demonstrates that carbon
dioxide naturally varies in the climate system. This is not a constant quantity.
Over the past 800,000 years it has varied within very clear bounds. But in the
past 250 years we have gone out of these bounds. The concentration in the
year 2013 was actually 30% higher than any concentration that the climate
system has experienced in the past 800,000 years.
And in fact we can make that other headline statement that says that “These
levels of carbon dioxide have been unprecedented in that time period.” Now
the reason why this increase has happened is the burning of fossil fuel by
man, plus deforestation and to a minor extent the production of cement.

Now Dr., you make a lot of flap yap claims, yet provide no backup for any of them. How about backing your claims with credible sources? Watts, obese junkies on the AM radio, and fake British Lords are not credible sources.
 
A 2013 paper based on fake data .................


No even accepted by main stream academia or scientist as not being fictitious.


Actually it's even worse than that. Not only do they use falsified data, they then use those numbers to populate the "data" sets they use to write the code for........MODELS!. This whole "paper" is a series of computer models of shit quality that are based on shit data.

From olfrauds link....

"Now we cannot go back as an experimental physicist would naturally do when they want to understand processes. We would go back to the beginning of the 20th century and re-do the experiment but we would just stop the emissions of fossil fuels and see what happens with the temperature. That would be really a telling experiment. But we can do almost as good as that by using comprehensive climate models and carry out that experiment on the computer.


Now you should know that these models have been forced by the information of a changing atmospheric condition in terms of greenhouse gases. So the information that carbon dioxide has increased, has been used by these model simulations, as well as the fact that some volcanic eruptions have happened in the past 150 years. That is also information that these models have available. As you see for example in these blips that occur here frequently in the record and in the model simulations. Now because this is quite good agreement that we find between the models and the observations we say, rather cautiously, models reproduce observed continental-scale surface temperature patterns and trends over many decades."


It is amazing that people who supposedly are so smart, haven't figured out that models aren't data, and that when they use actual data, that has been falsified, they are merely talking about science fiction and fraud....but not science.
 
So now we want to claim eclipses are responsible for what??

I said they're a measurement tool. If you want to claim they're "responsible" for something, that's just you being stupid again.

First of all you do realize that the rotation of the earth is tied to our calendar year??

Damn, that's stupid.

The earth doesn't care about our calendar. It does what it does. We adjust the calendar to match the behavior of the earth.

By stating that the rate of the earths rotation has changed

Damn, that's stupid.

Day length fluctuations - Wikipedia the free encyclopedia

would suggest that all modern astrological rules and laws do not apply.

Astrology?

That explains a lot. Your horoscope told you global warming wasn't real.

So how much time have we gained or lost by this change in rotation and did we increase rotational speed or loose rotational speed??

Look it up yourself. I gave you the link. Everyone else will just keep laughing at you.

You understand how you're humiliating all the other deniers here by association, right? They wish you'd shut up and stop embarrassing them.
 

Forum List

Back
Top