TroglocratsRdumb
Diamond Member
- Aug 11, 2017
- 36,162
- 46,285
- 2,915
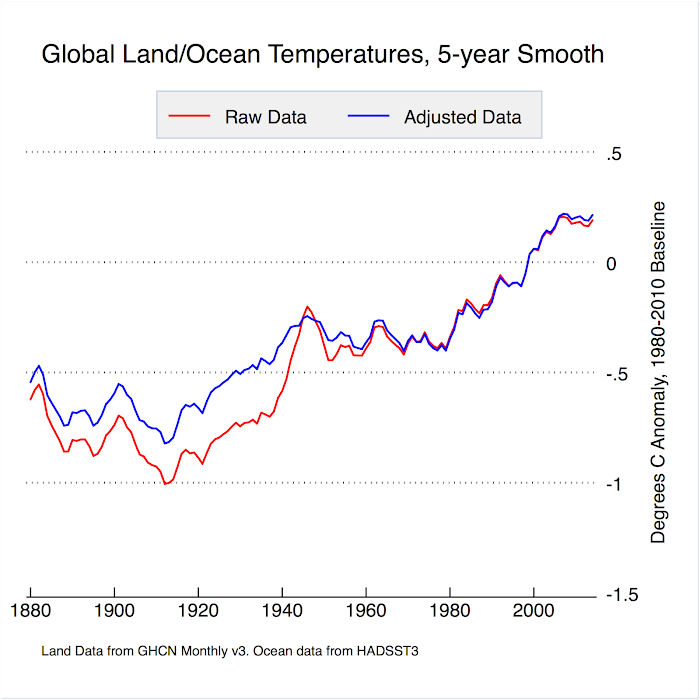
There is a huge margin of error in measuring the earth's present average temperature.
But when they attempt to speculate what the earth's average temperature was in the past that margin of error goes up dramatically.
Man made global warming is just a weak hypothesis and we should not be making any economic decisions based upon it.
The corrupt Left Wing politicians use man made global warming FEAR as their political tool to maintain their power and to line their pockets.