Briffa2013

while perusing Old Rocks latest link that defends MBH98,99, I found this rather concise comment on Briffa's pre-2013 work....

Who was the author?


And any response to Orogenicman? Hockey sticks are everywhere because that's what the Earth's temperatures have actually done.

No.. Hockey sticks are everywhere because authors append HIGH TEMPORAL RESOLUTION data to weak GLOBAL proxy studies that have no TEMPORAL resolution to show short term temperature events.. Using just 75 mud, ice, wood studies in a failed attempt to cover the entire globe --- will produce data so filtered --- IT HAS TO LOOK FLAT...

So, just to summarize, you believe that hockey sticks exist because for them not to exist would devastate your conspiracy theory that climate scientists are evil wizards out to destroy civilization while making the world safe for greenies. Got it. :cuckoo:
Would have been better if you didn't cork off with that bullshit.. Calls attention to the fact that you ADDRESSED NOTHING of substance in my last post...
 
No.. Hockey sticks are everywhere because authors append HIGH TEMPORAL RESOLUTION data to weak GLOBAL proxy studies that have no TEMPORAL resolution to show short term temperature events.. Using just 75 mud, ice, wood studies in a failed attempt to cover the entire globe --- will produce data so filtered --- IT HAS TO LOOK FLAT...

So, just to summarize, you believe that hockey sticks exist because for them not to exist would devastate your conspiracy theory that climate scientists are evil wizards out to destroy civilization while making the world safe for greenies. Got it. :cuckoo:

Would have been better if you didn't cork off with that bullshit.. Calls attention to the fact that you ADDRESSED NOTHING of substance in my last post...

That's correct. Deniers have nothing of substance to address.
 
while perusing Old Rocks latest link that defends MBH98,99, I found this rather concise comment on Briffa's pre-2013 work....

Briffa had published a paper in 1995 claiming that the medieval period actually contained the coldest year of the millennium. But this claim depended on just three tree ring records (called cores) from the Polar Urals. Later, a colleague of his named F. H. Schweingruber produced a much larger sample from the Polar Urals, but it told a very different story: The medieval era was actually quite warm and the late 20th century was unexceptional. Briffa and Schweingruber never published those data, instead they dropped the Polar Urals altogether from their climate reconstruction papers.

In its place they used a new series that Briffa had calculated from tree ring data from the nearby Yamal Peninsula that had a pronounced Hockey Stick shape: relatively flat for 900 years then sharply rising in the 20th century. This Yamal series was a composite of an undisclosed number of individual tree cores. In order to check the steps involved in producing the composite, it would be necessary to have the individual tree ring measurements themselves. But Briffa didn't release his raw data.

Over the next nine years, at least one paper per year appeared in prominent journals using Briffa's Yamal composite to support a hockey stick-like result. The IPCC relied on these studies to defend the Hockey Stick view, and since it had appointed Briffa himself to be the IPCC Lead Author for this topic, there was no chance it would question the Yamal data.

Despite the fact that these papers appeared in top journals like Nature and Science, none of the journal reviewers or editors ever required Briffa to release his Yamal data. Steve McIntyre's repeated requests for them to uphold their own data disclosure rules were ignored.

Then in 2008 Briffa, Schweingruber and some colleagues published a paper using the Yamal series (again) in a journal called the Philosophical Transactions of the Royal Society, which has very strict data-sharing rules. Steve sent in his customary request for the data, and this time an editor stepped up to the plate, ordering the authors to release their data. A short while ago the data appeared on the Internet. Steve could finally begin to unpack the Yamal composite.

It turns out that many of the samples were taken from dead (partially fossilized) trees and they have no particular trend. The sharp uptrend in the late 20th century came from cores of 10 living trees alive as of 1990, and five living trees alive as of 1995. Based on scientific standards, this is too small a sample on which to produce a publication-grade proxy composite. The 18th and 19th century portion of the sample, for instance, contains at least 30 trees per year. But that portion doesn't show a warming spike. The only segment that does is the late 20th century, where the sample size collapses. Once again a dramatic hockey stick shape turns out to depend on the least reliable portion of a dataset.

But an even more disquieting discovery soon came to light. Steve searched a paleoclimate data archive to see if there were other tree ring cores from at or near the Yamal site that could have been used to increase the sample size. He quickly found a large set of 34 up-to-date core samples, taken from living trees in Yamal by none other than Schweingruber himself! Had these been added to Briffa's small group the 20th century would simply be flat. It would appear completely unexceptional compared to the rest of the millennium.

After reading those allegations, honestly, how is anyone expected to trust many of the studies coming out with data to "prove" global warming? While we should hope that scientists are in the business of pursuing truth and presenting facts, the reality now is that many scientists are pursuing purely politicized interests. As we all know, once trust is lost, it is terribly difficult to recover. Thankfully, there are scientists and others, like McIntyre, McKitrick, and the Philosophical Transactions of the Royal Society, who seem to be pursuing truth and holding other scientists accountable.

And who was the author?


to tell you the truth, I don't know who wrote it. does it matter who wrote it? it certainly follows the timeline of how Briffa's work data came out into the public.

are you one of those people who cannot separate the legitimacy of facts and ideas from the person who actually presents them? I especially find it amusing when some of the warmers here dismiss an article when it is reposted on sceptic sites like WUWT only to fawn over it when it comes out on a CAGW site. (are your ears burning Old Rocks? they should be)
 
If there is empirical data to support it, by all means show us.

Which of the many hockey sticks do you want to see?

Bristlecone series
Glacial retreat
Yamal without YAD06
Boreholes
Ice Cores
Instrumental record
Tree rings from across the planet

And so on. That's why it's so amusing that denialists fixate on the single tree YAD06. That all even after McIntyre got caught cherrypicking what Yamal data sets he'd use, since cherrypicking was the only way he could get the hockey stick to vanish. And after he'd already gotten the data from the Russians, but lied and said Briffa was withholding it, even though Briffa didn't own the data and couldn't give it away.


warmers fixated on the Hockeystick graph, and then the spagetti graphs for a very long time. YAD061 is a prime example of what is wrong with many of the proxy series, that is why it is brought up. cherrypicking and the use of improbable data, combined with truncation of data that is inconvenient, is simply not good science.

Briffa2013 looks almost exactly like the skeptics said it should look, once a more complete set of data was used. yet Briffa 2008, and previous Briffa papers are still contaminating all the spagetti graphs from the 00's. I personally have a strong cynicism for all proxy reconstructions and I dont think they should ever be combined with high resolution temperature data because the public simply does not understand the difference in reliability and certainty between the two types of information.

Flac explained to you why all low resolution proxy series with appear hockeystick-like with modern data grafted on to the end. the Briffa series in MBH actually was a reverse hockeystick. if the correlation of treerings to temps was bad in the last half of the 20th century, why should we believe it was reliable at all other times? the Polar Ural series was dumped once additional trees were added. why was a series with a few trees going in the right direction used but then ignored when it had a much bigger data base? could it be because it no longer supported CAGW? isnt that cherry picking? will researchers now use Briffa 2013 with its broken hockeystick or will they use the past versions?

Except that there is no evidence that any of the hockey sticks are wrong, and plenty of evidence that the deniers lied, as the McIntyre (who is not a scientist) example aptly demonstrates.


McIntyre, the statistician, has not been shown to be a liar. furthermore, when he has been shown to be mistaken in some small detail he promptly admits to it and adds corrections to his papers. unlike the majority of the major climate scientists.

I am not an expert on temperature proxies but there is certainly enough evidence out there to be suspicious on both its reliability and how it is used.

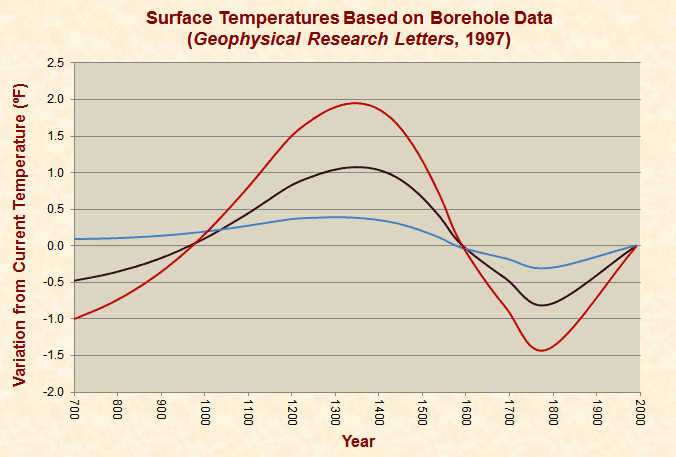
on of the spagetti graphs that the IPCC used had a borehole line on it, but it only went back 200 years. why is that? it may be because going further back does not fit the CAGW meme.

borehole.png

The three curves show the data with different weights assigned to it, the red being the strongest and the blue being the weakest that the authors think is merited

the borehole data that goes all the way back to 1000 sure looks like Lamb's proxy based graph from the first IPCC Report.

from an interesting site- Hide the Decline

I was actually looking for this graphic-

briffa2.PNG


if we leave in the deleted end pieces of Briffa's series, what sort of correlation to temperatures does it have? why is it OK to just use the parts that you want? if the first 100 years doesnt work, and the last 50 years doesnt work, why do we think the middle 300 years work?
 
The IPCC and Mann, the Hockey Stick, people here are in Denial, the IPCC and Mann lied. They got busted, literally destroying data, ignoring conclusions, and starting over.

but people are dumb, if they can google it they believe the result they find.
 
warmers fixated on the Hockeystick graph, and then the spagetti graphs for a very long time. YAD061 is a prime example of what is wrong with many of the proxy series, that is why it is brought up. cherrypicking and the use of improbable data, combined with truncation of data that is inconvenient, is simply not good science.

Briffa2013 looks almost exactly like the skeptics said it should look, once a more complete set of data was used. yet Briffa 2008, and previous Briffa papers are still contaminating all the spagetti graphs from the 00's. I personally have a strong cynicism for all proxy reconstructions and I dont think they should ever be combined with high resolution temperature data because the public simply does not understand the difference in reliability and certainty between the two types of information.

Flac explained to you why all low resolution proxy series with appear hockeystick-like with modern data grafted on to the end. the Briffa series in MBH actually was a reverse hockeystick. if the correlation of treerings to temps was bad in the last half of the 20th century, why should we believe it was reliable at all other times? the Polar Ural series was dumped once additional trees were added. why was a series with a few trees going in the right direction used but then ignored when it had a much bigger data base? could it be because it no longer supported CAGW? isnt that cherry picking? will researchers now use Briffa 2013 with its broken hockeystick or will they use the past versions?

Except that there is no evidence that any of the hockey sticks are wrong, and plenty of evidence that the deniers lied, as the McIntyre (who is not a scientist) example aptly demonstrates.


McIntyre, the statistician, has not been shown to be a liar. furthermore, when he has been shown to be mistaken in some small detail he promptly admits to it and adds corrections to his papers. unlike the majority of the major climate scientists.

I am not an expert on temperature proxies but there is certainly enough evidence out there to be suspicious on both its reliability and how it is used.

on of the spagetti graphs that the IPCC used had a borehole line on it, but it only went back 200 years. why is that? it may be because going further back does not fit the CAGW meme.

borehole.png

The three curves show the data with different weights assigned to it, the red being the strongest and the blue being the weakest that the authors think is merited

the borehole data that goes all the way back to 1000 sure looks like Lamb's proxy based graph from the first IPCC Report.

from an interesting site- Hide the Decline

I was actually looking for this graphic-

briffa2.PNG


if we leave in the deleted end pieces of Briffa's series, what sort of correlation to temperatures does it have? why is it OK to just use the parts that you want? if the first 100 years doesnt work, and the last 50 years doesnt work, why do we think the middle 300 years work?

So, just to be clear, you want to compare and contrast climate change issues by citing propaganda from a conservative web site run by one guy with a Bachelor's degree in Mechanical engineering (who's claim to expertise is technical sales) and another with a Bachelor's degree in Psychology (who doesn't even work in the field in which he has a degree, but instead has "expertise" in corporate management, operations, logistics, accounting, and customer service)? REALLY? This isn't any better than citing a certain denier who also happens to be a message therapist, and nothing more. No doubt if you need brain surgery, you will insist on consulting an auto mechanic.

Last time I checked --- it was OK to be a used car dealer and serve on the Senate Intelligience Commitee or the Energy Committee. Has that rule changed?

You should really address the ASSERTIONS and the REFERENCES given --- and not waste time impeaching sources because you don't like them.. Was there NOT a graph in that GRL Letter 1997 paper that is referenced in IAN's post? Do you doubt it exists?

Huang and Pollack, GRL Volume 24, 1997, page 1948 --- details on how to "tune" a borehole sample to fit your agenda...
 
Last edited:
McIntyre, the statistician, has not been shown to be a liar. furthermore, when he has been shown to be mistaken in some small detail he promptly admits to it and adds corrections to his papers. unlike the majority of the major climate scientists.

I am not an expert on temperature proxies but there is certainly enough evidence out there to be suspicious on both its reliability and how it is used.

on of the spagetti graphs that the IPCC used had a borehole line on it, but it only went back 200 years. why is that? it may be because going further back does not fit the CAGW meme.

borehole.png


the borehole data that goes all the way back to 1000 sure looks like Lamb's proxy based graph from the first IPCC Report.

from an interesting site- Hide the Decline

I was actually looking for this graphic-

briffa2.PNG


if we leave in the deleted end pieces of Briffa's series, what sort of correlation to temperatures does it have? why is it OK to just use the parts that you want? if the first 100 years doesnt work, and the last 50 years doesnt work, why do we think the middle 300 years work?

So, just to be clear, you want to compare and contrast climate change issues by citing propaganda from a conservative web site run by one guy with a Bachelor's degree in Mechanical engineering (who's claim to expertise is technical sales) and another with a Bachelor's degree in Psychology (who doesn't even work in the field in which he has a degree, but instead has "expertise" in corporate management, operations, logistics, accounting, and customer service)? REALLY? This isn't any better than citing a certain denier who also happens to be a message therapist, and nothing more. No doubt if you need brain surgery, you will insist on consulting an auto mechanic.

Last time I checked --- it was OK to be a used car dealer and serve on the Senate Intelligience Commitee or the Energy Committee. Has that rule changed?

You should really address the ASSERTIONS and the REFERENCES given --- and not waste time impeaching sources because you don't like them.. Was there NOT a graph in that GRL Letter 1997 paper that is referenced in IAN's post? Do you doubt it exists?

Huang and Pollack, GRL Volume 24, 1997, page 1948 --- details on how to "tune" a borehole sample to fit your agenda...

You should address your denier spokesmens' utter lack of qualifications in scientific matters. Until you do, you have no credibility in these discussions. A mechanical engineer, a B.S. in Psychology, a former DJ, and a message therapist? These are the best you people can do? Really? How pathetic is that?
 
The IPCC and Mann, the Hockey Stick, people here are in Denial, the IPCC and Mann lied. They got busted, literally destroying data, ignoring conclusions, and starting over.

but people are dumb, if they can google it they believe the result they find.

You did a google looking for a lie and believed what you found.
 
You know, I find it astounding how many non-scientists these deniers tend to quote mine. If NASA relied on such out-of-the-field people these deniers do, they would never have gotten off the launch pad.
 
You know, I find it astounding how many non-scientists these deniers tend to quote mine. If NASA relied on such out-of-the-field people these deniers do, they would never have gotten off the launch pad.

I find it astounding that you guys ignore the ideas behind the science and would rather just appeal to authority.

If Briffa's series has to be neatly snipped to get rid of inconvenient results, what does that say about its reliability? If this series is 'adjusted, what does that say about other series that have not been so heavily scrutinized?

Climate science seems to get offended when statisticians question their methods. Why is that?

Even if you get the right answer but use incorrect methods to achieve it then the answer is wrong. Or at least unreliable.
 
I find it astounding that you guys ignore the ideas behind the science and would rather just appeal to authority.

I find it astounding that you would make such a statement. Argument from authority is a class of argument, not a fallacy. It can be used improperly, but it is most assuredly not inherently false.

Wikipedia:

Argument from authority (Argumentum ab auctoritate), also authoritative argument, appeal to authority, and false authority, is an inductive reasoning argument that often takes the form of a statistical syllogism. Although certain classes of argument from authority can constitute strong inductive arguments, the appeal to authority is often applied fallaciously.

Fallacious examples of using the appeal include:

1) cases where the authority is not a subject-matter expert
2) cases where there is no consensus among experts in the subject matter
3) any appeal to authority used in the context of deductive reasoning.

[As you can see, Ian, we have made none of these errors while they are absolutely rife on the denier side of the argument]

In our case, the authorities to which we appeal ARE subject matter experts. Their IS a very strong consensus among the experts and we are NOT attempting to make a deductive claim based on their opinions.

So... suck eggs dude. ;-)


you have been saying, "they are climate scientists, so we should believe them". I have been saying they have been breaking the rules of science, and using methodologies unacceptable to the purpose.

no scientist should condone Briffa for throwing out 1/3 of his series because it is inconvenient to the 'story'. basic science insists that you try to find evidence that could invalidate your work and conclusions, not slice(edit- splice) together the pieces that support you like a Hollywood film editor, and then throw out the leftovers in the trash.

while Briffa was not the B in MBH98, he was an instrumental contributor and he signed on with padding his series with modern temps and smoothing to get the lines to match up. no statistician would agree to that, or Mann's use of uncentered PCs, or a host of other disreputable methods.

science is supposed to be replicable. why then does climate science hide their data? without skeptics scrutinizing peer (read pal) reviewed papers with obvious flaws then no one would be the wiser. because we should all just believe in 'the climate scientists'.
 
Last edited:
you have been saying, "they are climate scientists, so we should believe them".

No, we've been saying your pals aren't scientists, certainly have no expertise in climate science, and have a vested political interest in the outcome of climate science research. And so to side with those bozos puts you in a very precarious credibility position.

Whether it is stock prices, radar data, tree ring data, or astronomy data, ALL DATA CONTAINS NOISE THAT MUST BE FILTERED SO AS TO REDUCE BIAS. And Ian, the modern data contains more precision, and so adding it to his series only made it MORE precise, not less. Furthermore, it was well known that certain recent tree ring data was inaccurate when compared to instrument measurements. The fact of the matter is that if he had not calibrated his data, you punks would have found fault with that as well, and so in your eyes, he was fucked no matter what he did. And that was not a coincidence, by the way. It was intentional misrepresentation of the facts by the lunatic fringe deniers.

No data is being hidden. That's also a gross misrepresentation of the facts. All of the data is readily available, as you folks very well know. Your problem is that you don't want to put in the hard work that these guys have to acquire it and compile it into a useful format. Your own laziness is no one else's fault.
 
Last edited:
So, just to be clear, you want to compare and contrast climate change issues by citing propaganda from a conservative web site run by one guy with a Bachelor's degree in Mechanical engineering (who's claim to expertise is technical sales) and another with a Bachelor's degree in Psychology (who doesn't even work in the field in which he has a degree, but instead has "expertise" in corporate management, operations, logistics, accounting, and customer service)? REALLY? This isn't any better than citing a certain denier who also happens to be a message therapist, and nothing more. No doubt if you need brain surgery, you will insist on consulting an auto mechanic.

Last time I checked --- it was OK to be a used car dealer and serve on the Senate Intelligience Commitee or the Energy Committee. Has that rule changed?

You should really address the ASSERTIONS and the REFERENCES given --- and not waste time impeaching sources because you don't like them.. Was there NOT a graph in that GRL Letter 1997 paper that is referenced in IAN's post? Do you doubt it exists?

Huang and Pollack, GRL Volume 24, 1997, page 1948 --- details on how to "tune" a borehole sample to fit your agenda...

You should address your denier spokesmens' utter lack of qualifications in scientific matters. Until you do, you have no credibility in these discussions. A mechanical engineer, a B.S. in Psychology, a former DJ, and a message therapist? These are the best you people can do? Really? How pathetic is that?

I'm a former rock star, italian restaurant prep specialist, and surfer bum.. Think my clients care about any of that? Einstein was a mere patent office clerk.. You're off in the weeds.

What matters is the quality of the discussion.. The "fame and glory" is never based solely on credentials. If that were the case -- TED talks wouldn't be playing to booming multidisciplanary crowds, new pharmaceuticals wouldn't be being discovered by biologists and oceanographers, and DNA analysis would be back in the dark ages.

nsf.gov - National Science Foundation (NSF) Discoveries - Top Scientists Promote Innovative, Multidisciplinary Global Problem-Solving Strategies - US National Science Foundation (NSF)


"If you want science students to be more mathematical, you can't solve the problem just by sending them off to the math department,' said Bialek. "Instead, we need to teach them how math is integrated into the scientific world."

So, for example, although freshmen are typically introduced to probability in math classes and to gas laws in physics classes, freshmen in Princeton's interdepartmental program are introduced to these topics in a single class that shows how probabilistic concepts apply to problems ranging from the ideal gas to genetics to Brownian motion. Such classes are accompanied by group exercises that introduce students to the types of collaboration required of professional scientists. :clap2:


Princeton's program, according to Bialek, targets freshmen for the same reason that schools should introduce foreign languages to children as early in their education as possible: the younger you are, the easier it is to become bilingual and to become fluent in multiple scientific disciplines.

Maybe I'm spoiled by the fact that my specialities are used in so many different disciplines. A fact that has constantly sent me BACK to academia to learn. But all I see from my prospective are breakthrus that REQUIRE collaborations between disparate disciplines and a HISTORY of MASTER scientists who were never told they weren't chemists or physicists.
 
You've got to have some second thoughts when you see that damn near EVERY individual with the training to understand this topic DISAGREES WITH YOU and that those who DO, tend to be uneducated polemicists.
 

Forum List

Back
Top