So... how many data points do you believe they had for the four previous interglacial transitions?LOL Playing stupid again. LOL
Navigation
Install the app
How to install the app on iOS
Follow along with the video below to see how to install our site as a web app on your home screen.

Note: This feature currently requires accessing the site using the built-in Safari browser.
More options
You are using an out of date browser. It may not display this or other websites correctly.
You should upgrade or use an alternative browser.
You should upgrade or use an alternative browser.
Arctic heat
- Thread starter Old Rocks
- Start date
Billy_Bob
Diamond Member
Its rather amusing that you show these retards that the speed of warming is the same and that the current spike is at the same rate of change as previous (even though it is so small its hard to discern) warm ups.
What is more concerning to me is the rate of cooling which always follows at the same rapid rate of decline.. For some reason they don't like to talk about that half of the equation.. Its as if they deny what empirical evidence says will happen and that man will magically make the temp runaway...
Their problem is that they are calculating the slope off of a graph that has way more data points than what we have from the oxygen isotope curve and assuming that if we had more data available to us that it wouldn't change the slope. The reality is that it is unrealistic to assume that we had the same slope for thousands of years. Given the complexity of the climate system, I would expect to see slip stick differential behavior during the thousands of year march from the glacial to interglacial transition.
Its rather amusing that you show these retards that the speed of warming is the same and that the current spike is at the same rate of change as previous (even though it is so small its hard to discern) warm ups.
What is more concerning to me is the rate of cooling which always follows at the same rapid rate of decline.. For some reason they don't like to talk about that half of the equation.. Its as if they deny what empirical evidence says will happen and that man will magically make the temp runaway...
Besides, their argument is a red herring anyway. The only thing that matters is that we are still well inside the norm of the interglacial temperature rise. Everything we see today, with the exception of rising CO2 levels, can be explained by the transition from glacial to interglacial cycle. In fact, I wouldn't be surprised if our temperature rose another 1.4 C to 2.4 C before the next glacial cycle were triggered.
Last edited:
Billy_Bob
Diamond Member
Their problem is that they are calculating the slope off of a graph that has way more data points than what we have from the oxygen isotope curve and assuming that if we had more data available to us that it wouldn't change the slope. The reality is that it is unrealistic to assume that we had the same slope for thousands of years. Given the complexity of the climate system, I would expect to see slip stick differential behavior during the thousands of year march from the glacial to interglacial transition.
Its rather amusing that you show these retards that the speed of warming is the same and that the current spike is at the same rate of change as previous (even though it is so small its hard to discern) warm ups.
What is more concerning to me is the rate of cooling which always follows at the same rapid rate of decline.. For some reason they don't like to talk about that half of the equation.. Its as if they deny what empirical evidence says will happen and that man will magically make the temp runaway...
Besides, their argument is a red herring anyway. The only thing that matters is that we are still well inside the norm of the interglacial temperature rise. Everything we see today, with the exception of rising CO2 levels, can be explained by the transition from glacial to interglacial cycle. In fact, I wouldn't be surprised if our temperature rose another 1.4 C to 2.4 C before the next glacial cycle were triggered.
They hate the words "Natural Variation" because it implies that what were seeing is not controlled by man... which means they can not use it to create populace control..
Population control is their dirty little secret that they do not want to discuss but is the thing that keeps them up at night.Their problem is that they are calculating the slope off of a graph that has way more data points than what we have from the oxygen isotope curve and assuming that if we had more data available to us that it wouldn't change the slope. The reality is that it is unrealistic to assume that we had the same slope for thousands of years. Given the complexity of the climate system, I would expect to see slip stick differential behavior during the thousands of year march from the glacial to interglacial transition.
Its rather amusing that you show these retards that the speed of warming is the same and that the current spike is at the same rate of change as previous (even though it is so small its hard to discern) warm ups.
What is more concerning to me is the rate of cooling which always follows at the same rapid rate of decline.. For some reason they don't like to talk about that half of the equation.. Its as if they deny what empirical evidence says will happen and that man will magically make the temp runaway...
Besides, their argument is a red herring anyway. The only thing that matters is that we are still well inside the norm of the interglacial temperature rise. Everything we see today, with the exception of rising CO2 levels, can be explained by the transition from glacial to interglacial cycle. In fact, I wouldn't be surprised if our temperature rose another 1.4 C to 2.4 C before the next glacial cycle were triggered.
They hate the words "Natural Variation" because it implies that what were seeing is not controlled by man... which means they can not use it to create populace control..
Old Rocks
Diamond Member
- Thread starter
- #246
How is Today’s Warming Different from the Past?
Earth has experienced climate change in the past without help from humanity. We know about past climates because of evidence left in tree rings, layers of ice in glaciers, ocean sediments, coral reefs, and layers of sedimentary rocks. For example, bubbles of air in glacial ice trap tiny samples of Earth’s atmosphere, giving scientists a history of greenhouse gases that stretches back more than 800,000 years. The chemical make-up of the ice provides clues to the average global temperature.
See the Earth Observatory’s series Paleoclimatology for details about how scientists study past climates.


Glacial ice and air bubbles trapped in it (top) preserve an 800,000-year record of temperature & carbon dioxide. Earth has cycled between ice ages (low points, large negative anomalies) and warm interglacials (peaks). (Photograph courtesy National Snow & Ice Data Center.NASA graph by Robert Simmon, based on data from Jouzel et al., 2007.)
Using this ancient evidence, scientists have built a record of Earth’s past climates, or “paleoclimates.” The paleoclimate record combined with global models shows past ice ages as well as periods even warmer than today. But the paleoclimate record also reveals that the current climatic warming is occurring much more rapidly than past warming events.
As the Earth moved out of ice ages over the past million years, the global temperature rose a total of 4 to 7 degrees Celsius over about 5,000 years. In the past century alone, the temperature has climbed 0.7 degrees Celsius, roughly ten times faster than the average rate of ice-age-recovery warming.

Temperature histories from paleoclimate data (green line) compared to the history based on modern instruments (blue line) suggest that global temperature is warmer now than it has been in the past 1,000 years, and possibly longer. (Graph adapted from Mann et al., 2008.)
Models predict that Earth will warm between 2 and 6 degrees Celsius in the next century. When global warming has happened at various times in the past two million years, it has taken the planet about 5,000 years to warm 5 degrees. The predicted rate of warming for the next century is at least 20 times faster. This rate of change is extremely unusual.
Global Warming : Feature Articles
One can clearly see what NASA is graphing for us here. The Arctic is rapidly warming exactly as the graph shows. Now whose interpretation of these graphs do we believe? NASA or Dingleberrys?
Earth has experienced climate change in the past without help from humanity. We know about past climates because of evidence left in tree rings, layers of ice in glaciers, ocean sediments, coral reefs, and layers of sedimentary rocks. For example, bubbles of air in glacial ice trap tiny samples of Earth’s atmosphere, giving scientists a history of greenhouse gases that stretches back more than 800,000 years. The chemical make-up of the ice provides clues to the average global temperature.
See the Earth Observatory’s series Paleoclimatology for details about how scientists study past climates.
Glacial ice and air bubbles trapped in it (top) preserve an 800,000-year record of temperature & carbon dioxide. Earth has cycled between ice ages (low points, large negative anomalies) and warm interglacials (peaks). (Photograph courtesy National Snow & Ice Data Center.NASA graph by Robert Simmon, based on data from Jouzel et al., 2007.)
Using this ancient evidence, scientists have built a record of Earth’s past climates, or “paleoclimates.” The paleoclimate record combined with global models shows past ice ages as well as periods even warmer than today. But the paleoclimate record also reveals that the current climatic warming is occurring much more rapidly than past warming events.
As the Earth moved out of ice ages over the past million years, the global temperature rose a total of 4 to 7 degrees Celsius over about 5,000 years. In the past century alone, the temperature has climbed 0.7 degrees Celsius, roughly ten times faster than the average rate of ice-age-recovery warming.
Temperature histories from paleoclimate data (green line) compared to the history based on modern instruments (blue line) suggest that global temperature is warmer now than it has been in the past 1,000 years, and possibly longer. (Graph adapted from Mann et al., 2008.)
Models predict that Earth will warm between 2 and 6 degrees Celsius in the next century. When global warming has happened at various times in the past two million years, it has taken the planet about 5,000 years to warm 5 degrees. The predicted rate of warming for the next century is at least 20 times faster. This rate of change is extremely unusual.
Global Warming : Feature Articles
One can clearly see what NASA is graphing for us here. The Arctic is rapidly warming exactly as the graph shows. Now whose interpretation of these graphs do we believe? NASA or Dingleberrys?
As the Earth moved out of ice ages over the past million years, the global temperature rose a total of 4 to 7 degrees Celsius over about 5,000 years.
How many data points did they have over that 5000 year period?
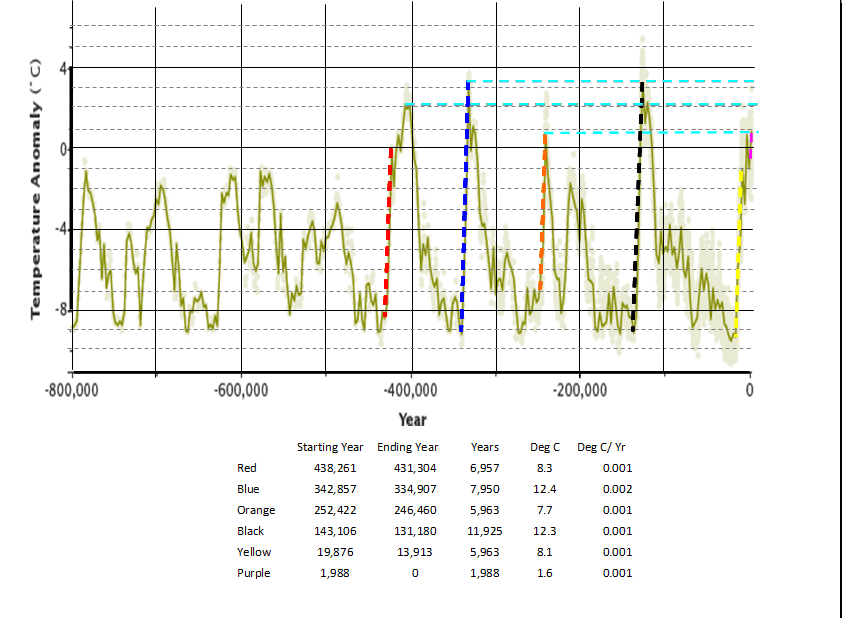
When are you going to acknowledge that the present interglacial cycle is 1.4C to 2.4C below the peak temperatures of three of the last four interglacials?How is Today’s Warming Different from the Past?
Earth has experienced climate change in the past without help from humanity. We know about past climates because of evidence left in tree rings, layers of ice in glaciers, ocean sediments, coral reefs, and layers of sedimentary rocks. For example, bubbles of air in glacial ice trap tiny samples of Earth’s atmosphere, giving scientists a history of greenhouse gases that stretches back more than 800,000 years. The chemical make-up of the ice provides clues to the average global temperature.
See the Earth Observatory’s series Paleoclimatology for details about how scientists study past climates.
Glacial ice and air bubbles trapped in it (top) preserve an 800,000-year record of temperature & carbon dioxide. Earth has cycled between ice ages (low points, large negative anomalies) and warm interglacials (peaks). (Photograph courtesy National Snow & Ice Data Center.NASA graph by Robert Simmon, based on data from Jouzel et al., 2007.)
Using this ancient evidence, scientists have built a record of Earth’s past climates, or “paleoclimates.” The paleoclimate record combined with global models shows past ice ages as well as periods even warmer than today. But the paleoclimate record also reveals that the current climatic warming is occurring much more rapidly than past warming events.
As the Earth moved out of ice ages over the past million years, the global temperature rose a total of 4 to 7 degrees Celsius over about 5,000 years. In the past century alone, the temperature has climbed 0.7 degrees Celsius, roughly ten times faster than the average rate of ice-age-recovery warming.
Temperature histories from paleoclimate data (green line) compared to the history based on modern instruments (blue line) suggest that global temperature is warmer now than it has been in the past 1,000 years, and possibly longer. (Graph adapted from Mann et al., 2008.)
Models predict that Earth will warm between 2 and 6 degrees Celsius in the next century. When global warming has happened at various times in the past two million years, it has taken the planet about 5,000 years to warm 5 degrees. The predicted rate of warming for the next century is at least 20 times faster. This rate of change is extremely unusual.
Global Warming : Feature Articles
One can clearly see what NASA is graphing for us here. The Arctic is rapidly warming exactly as the graph shows. Now whose interpretation of these graphs do we believe? NASA or Dingleberrys?
peabody
Gold Member
- Aug 14, 2016
- 1,107
- 102
- 130
I knew he was a liberal !!
Trump shifts position on climate change
He is "open-minded" about human impact on climate change, and what can be done about it.
"Look, I'm somebody that gets it and nobody really knows," Trump said. "It's not something that's so hard and fast."
http://www.usatoday.com/story/news/...egations-russian-election-tampering/95297756/
Old Rocks
Diamond Member
- Thread starter
- #250
NASA itself states your interpretation is pure shit. Oh, who to believe, an anonymous poster, or NASA?When are you going to acknowledge that the present interglacial cycle is 1.4C to 2.4C below the peak temperatures of three of the last four interglacials?How is Today’s Warming Different from the Past?
Earth has experienced climate change in the past without help from humanity. We know about past climates because of evidence left in tree rings, layers of ice in glaciers, ocean sediments, coral reefs, and layers of sedimentary rocks. For example, bubbles of air in glacial ice trap tiny samples of Earth’s atmosphere, giving scientists a history of greenhouse gases that stretches back more than 800,000 years. The chemical make-up of the ice provides clues to the average global temperature.
See the Earth Observatory’s series Paleoclimatology for details about how scientists study past climates.
Glacial ice and air bubbles trapped in it (top) preserve an 800,000-year record of temperature & carbon dioxide. Earth has cycled between ice ages (low points, large negative anomalies) and warm interglacials (peaks). (Photograph courtesy National Snow & Ice Data Center.NASA graph by Robert Simmon, based on data from Jouzel et al., 2007.)
Using this ancient evidence, scientists have built a record of Earth’s past climates, or “paleoclimates.” The paleoclimate record combined with global models shows past ice ages as well as periods even warmer than today. But the paleoclimate record also reveals that the current climatic warming is occurring much more rapidly than past warming events.
As the Earth moved out of ice ages over the past million years, the global temperature rose a total of 4 to 7 degrees Celsius over about 5,000 years. In the past century alone, the temperature has climbed 0.7 degrees Celsius, roughly ten times faster than the average rate of ice-age-recovery warming.
Temperature histories from paleoclimate data (green line) compared to the history based on modern instruments (blue line) suggest that global temperature is warmer now than it has been in the past 1,000 years, and possibly longer. (Graph adapted from Mann et al., 2008.)
Models predict that Earth will warm between 2 and 6 degrees Celsius in the next century. When global warming has happened at various times in the past two million years, it has taken the planet about 5,000 years to warm 5 degrees. The predicted rate of warming for the next century is at least 20 times faster. This rate of change is extremely unusual.
Global Warming : Feature Articles
One can clearly see what NASA is graphing for us here. The Arctic is rapidly warming exactly as the graph shows. Now whose interpretation of these graphs do we believe? NASA or Dingleberrys?
When are you going to acknowledge that the present interglacial cycle is 1.4C to 2.4C below the peak temperatures of three of the last four interglacials?NASA itself states your interpretation is pure shit. Oh, who to believe, an anonymous poster, or NASA?When are you going to acknowledge that the present interglacial cycle is 1.4C to 2.4C below the peak temperatures of three of the last four interglacials?How is Today’s Warming Different from the Past?
Earth has experienced climate change in the past without help from humanity. We know about past climates because of evidence left in tree rings, layers of ice in glaciers, ocean sediments, coral reefs, and layers of sedimentary rocks. For example, bubbles of air in glacial ice trap tiny samples of Earth’s atmosphere, giving scientists a history of greenhouse gases that stretches back more than 800,000 years. The chemical make-up of the ice provides clues to the average global temperature.
See the Earth Observatory’s series Paleoclimatology for details about how scientists study past climates.
Glacial ice and air bubbles trapped in it (top) preserve an 800,000-year record of temperature & carbon dioxide. Earth has cycled between ice ages (low points, large negative anomalies) and warm interglacials (peaks). (Photograph courtesy National Snow & Ice Data Center.NASA graph by Robert Simmon, based on data from Jouzel et al., 2007.)
Using this ancient evidence, scientists have built a record of Earth’s past climates, or “paleoclimates.” The paleoclimate record combined with global models shows past ice ages as well as periods even warmer than today. But the paleoclimate record also reveals that the current climatic warming is occurring much more rapidly than past warming events.
As the Earth moved out of ice ages over the past million years, the global temperature rose a total of 4 to 7 degrees Celsius over about 5,000 years. In the past century alone, the temperature has climbed 0.7 degrees Celsius, roughly ten times faster than the average rate of ice-age-recovery warming.
Temperature histories from paleoclimate data (green line) compared to the history based on modern instruments (blue line) suggest that global temperature is warmer now than it has been in the past 1,000 years, and possibly longer. (Graph adapted from Mann et al., 2008.)
Models predict that Earth will warm between 2 and 6 degrees Celsius in the next century. When global warming has happened at various times in the past two million years, it has taken the planet about 5,000 years to warm 5 degrees. The predicted rate of warming for the next century is at least 20 times faster. This rate of change is extremely unusual.
Global Warming : Feature Articles
One can clearly see what NASA is graphing for us here. The Arctic is rapidly warming exactly as the graph shows. Now whose interpretation of these graphs do we believe? NASA or Dingleberrys?
Old Rocks
Diamond Member
- Thread starter
- #252
When are you going to acknowledge those higher temperatures occurred far slower than the changes we are seeing today? When are you going to acknowledge that there was far higher sea levels at those times, levels that were accomplished with only a CO2 level of 300 ppm? And we are past 400 ppm right now? When are you going to acknowledge that your failure to post links to the articles that are the original sources of the graphs is a form of lying when your interpretations of the graphs are 180 degrees from those of the scientists?
Never because there are not enough data points from the oxygen isotope to determine that. We only have two points for each of the slopes I drew. For all we know there were periods within those 5000 year plus intervals where they were.When are you going to acknowledge those higher temperatures occurred far slower than the changes we are seeing today? When are you going to acknowledge that there was far higher sea levels at those times, levels that were accomplished with only a CO2 level of 300 ppm? And we are past 400 ppm right now? When are you going to acknowledge that your failure to post links to the articles that are the original sources of the graphs is a form of lying when your interpretations of the graphs are 180 degrees from those of the scientists?
I haven't seen any sea level data for the past 400,000 years but I found this and the peak at 125,000 years ago corresponds to the timing of the last interglacial cycle which had a 2.4C higher peak temperature than we do now and the sea level is roughly the same as it is now. But I would be happy enough to acknowledge that warmer temperature will correlate to higher sea levels if it will make you happy.
As for CO2 levels during the glacial-interglacial cycles, CO2 lags temperature by 800 years and is due to the cyclicity of CO2 and the ocean temperature. But if it will make you happy, I will be glad to acknowledge that man is responsible for rising CO2 levels.
I have already explained to you that you know where my link came from because I got the link from you. I'm not hiding anything. I am happy to acknowledge that link you had pointed to their belief that temperatures are rising faster than they have in the past. I disagree because based on the number of data points it is not possible to make that determination, nor is it relevant to the fact that our present temperature is 1.4C to 2.4C lower than the peak temperatures of three of the four past interglacials.
Now when are you going to acknowledge that the present interglacial cycle is 1.4C to 2.4C below the peak temperatures of three of the last four interglacials?
- May 20, 2009
- 144,459
- 66,848
- 2,330
All we know is that they were able to pump massive amount of CO2 into the atmosphere. Maybe they exhaled twice for every inhale?What was human culture like during those previous interglacials? What was the world population?

What was human culture like during those previous interglacials? What was the world population?
Who cares. The changes that happened back then were NATURAL. Thus, any changes today must likewise be construed as NATURAL, unless you can find truly compelling evidence that says otherwise. Merely wishing it to be so, and concocting computer derived fictions to bolster your wanting, don't cut it.
When are you going to acknowledge those higher temperatures occurred far slower than the changes we are seeing today? When are you going to acknowledge that there was far higher sea levels at those times, levels that were accomplished with only a CO2 level of 300 ppm? And we are past 400 ppm right now? When are you going to acknowledge that your failure to post links to the articles that are the original sources of the graphs is a form of lying when your interpretations of the graphs are 180 degrees from those of the scientists?
They didn't. There are more than a few peer reviewed studies for the Sierra Nevada that show during the MWP the temp skyrocketed up faster than today, and attained a temp at least 2.5 degrees warmer than the present time. The warming we enjoyed over the last 150 years has been nice, but far lower than the average level of warmth the planet is usually basking in. Well, when it ain't freezing to death that is.
Show us these "more than a few peer reviewed studies" showing the MWP skyrocketing up. And, if you're talking about an isolated region and not the planet as a whole, take your pile and shovel it elsewhere.
From Wikipedia's article on the Medieval Warm Period
Despite uncertainties, especially for the period prior to 1600 for which data are scarce, the warmest period of the last 2,000 years prior to the 20th century in the Northern Hemisphere very likely occurred between 950 and 1100. Proxy records show peak warmth occurred at different times for different regions, indicating that the Medieval Warm Period was not a time of globally uniform change.[7] Temperatures in some regions matched or exceeded recent temperatures in these regions, but globally the Medieval Warm Period was cooler than recent global temperatures.[4]
4. Mann, M. E.; Zhang, Z.; Rutherford, S.; et al. (2009). "Global Signatures and Dynamical Origins of the Little Ice Age and Medieval Climate Anomaly". Science. 326 (5957): 1256–60. Bibcode:2009Sci...326.1256M. doi:10.1126/science.1177303. PMID 19965474.
7. Solomon, Susan Snell; Intergovernmental Panel on Climate Change (2007). "6.6 The Last 2,000 Years". Climate change 2007: the physical science basis: contribution of Working Group I to the Fourth Assessment Report of the Intergovernmental Panel on Climate Change. Cambridge: Cambridge University Press for the Intergovernmental Panel on Climate Change. ISBN 0-521-70596-7. Box 6.4
Further analysis of the bulk compilation of all paleoclimatology studies that were done in various areas around the globe appear to indicate a global trend of warming, particularly in the northern and southern peaks but less towards the equator.[16] More recently, a study by the Pages-2k consortium suggests the warming was not globally synchronous: "Our regional temperature reconstructions also show little evidence for globally synchronized multi-decadal shifts that would mark well-defined worldwide MWP and LIA intervals. Instead, the specific timing of peak warm and cold intervals varies regionally, with multi-decadal variability resulting in regionally specific temperature departures from an underlying global cooling trend."[17]
17. https://www.blogs.uni-mainz.de/fb09climatology/files/2012/03/Pages_2013_NatureGeo.pdf
SSDD
Gold Member
- Nov 6, 2012
- 16,672
- 1,966
- 280
Show us these "more than a few peer reviewed studies" showing the MWP skyrocketing up. And, if you're talking about an isolated region and not the planet as a whole, take your pile and shovel it elsewhere.
Sure crick..but just to be fair...you name the region of the world and I will go out and find you both level one and level two studies supporting the statement that the MWP was both global in nature, and warmer than the present..
Show us these "more than a few peer reviewed studies" showing the MWP skyrocketing up. And, if you're talking about an isolated region and not the planet as a whole, take your pile and shovel it elsewhere.
From Wikipedia's article on the Medieval Warm Period
Despite uncertainties, especially for the period prior to 1600 for which data are scarce, the warmest period of the last 2,000 years prior to the 20th century in the Northern Hemisphere very likely occurred between 950 and 1100. Proxy records show peak warmth occurred at different times for different regions, indicating that the Medieval Warm Period was not a time of globally uniform change.[7] Temperatures in some regions matched or exceeded recent temperatures in these regions, but globally the Medieval Warm Period was cooler than recent global temperatures.[4]
4. Mann, M. E.; Zhang, Z.; Rutherford, S.; et al. (2009). "Global Signatures and Dynamical Origins of the Little Ice Age and Medieval Climate Anomaly". Science. 326 (5957): 1256–60. Bibcode:2009Sci...326.1256M. doi:10.1126/science.1177303. PMID 19965474.
7. Solomon, Susan Snell; Intergovernmental Panel on Climate Change (2007). "6.6 The Last 2,000 Years". Climate change 2007: the physical science basis: contribution of Working Group I to the Fourth Assessment Report of the Intergovernmental Panel on Climate Change. Cambridge: Cambridge University Press for the Intergovernmental Panel on Climate Change. ISBN 0-521-70596-7. Box 6.4
Further analysis of the bulk compilation of all paleoclimatology studies that were done in various areas around the globe appear to indicate a global trend of warming, particularly in the northern and southern peaks but less towards the equator.[16] More recently, a study by the Pages-2k consortium suggests the warming was not globally synchronous: "Our regional temperature reconstructions also show little evidence for globally synchronized multi-decadal shifts that would mark well-defined worldwide MWP and LIA intervals. Instead, the specific timing of peak warm and cold intervals varies regionally, with multi-decadal variability resulting in regionally specific temperature departures from an underlying global cooling trend."[17]
17. https://www.blogs.uni-mainz.de/fb09climatology/files/2012/03/Pages_2013_NatureGeo.pdf
Here is one...
Quaternary Research, vol 66, p. 273.
"Deadwood tree stems scattered above treeline on tephra-covered slopes of Whitewing Mtn (3051 m) and San Joaquin Ridge (3122 m) show evidence of being killed in an eruption from adjacent Glass Creek Vent, Inyo Craters. Using tree-ring methods, we dated deadwood to AD 815–1350 and infer from death dates that the eruption occurred in late summer AD 1350. Based on wood anatomy, we identified deadwood species as Pinus albicaulis, P. monticola, P. lambertiana, P. contorta, P. jeffreyi, and Tsuga mertensiana. Only P. albicaulis grows at these elevations currently; P. lambertiana is not locally native. Using contemporary distributions of the species, we modeled paleoclimate during the time of sympatry to be significantly warmer (+3.2°C annual minimum temperature) and slightly drier (−24 mm annual precipitation) than present, resembling values projected for California in the next 70–100 yr."
Similar threads
- Replies
- 10
- Views
- 1K
- Replies
- 118
- Views
- 2K
- Replies
- 648
- Views
- 7K
Latest Discussions
- Replies
- 2
- Views
- 13
- Replies
- 1K
- Views
- 17K
- Replies
- 95
- Views
- 539
Forum List
-
-
-
-
-
Political Satire 8079
-
-
-
-
-
-
-
-
-
-
-
-
-
-
-
-
-
-
-
ObamaCare 781
-
-
-
-
-
-
-
-
-
-
-
Member Usernotes 471
-
-
-
-
-
-
-
-
-
-