Navigation
Install the app
How to install the app on iOS
Follow along with the video below to see how to install our site as a web app on your home screen.
Note: This feature may not be available in some browsers.
More options
You are using an out of date browser. It may not display this or other websites correctly.
You should upgrade or use an alternative browser.
You should upgrade or use an alternative browser.
Antarctic Ice Breaks All Records
- Thread starter Katzndogz
- Start date
saveliberty
Diamond Member
- Oct 12, 2009
- 58,756
- 10,843
- 2,030
I think you are confused by the ice in your long island ice tea.
saveliberty
Diamond Member
- Oct 12, 2009
- 58,756
- 10,843
- 2,030
Does melting ice in your drink foretell of global warming?
jc456
Diamond Member
- Dec 18, 2013
- 141,616
- 30,081
- 2,180
What a boob!I think you may be confusing the sea ice off the coast with the ice sheet ashore.
GRACE and laser altimetry are highly complex calculations that are dependent on numerous assumptions such as the rate of rebound etc. the time frame of these measurements is very short and therefore the error bars are large.
a couple of years ago Zwicky (an Arctic death spiral prophet) came to the conclusion that the Antarctic ice cap was increasing using a laser altimetry method. curiously it never got the public press releases that other more malignant studies did.
I do not know whether the Antarctic is gaining or losing ice mass overall. it does appear that the volcanically active west side and penninsula are warming and losing mass. the thermal inertia of cubic kilometers of ice seems to me to preclude the very recent addition of CO2 as the main cause of any changes that may be happening.
The rate of mass loss from the Antarctic ice sheet does not support what seems to be your 'feeling' about the thermal inertial of the ice sheet's mass. For one the flow rate of glaciers streaming into the Amundsen Sea is not a parameter that would be checked by thermal inertia.
elektra
Platinum Member
Sure, but the experiment to prove the theory and models behind your assertion were proven false during the MV Akademik Shokalski experiment, 40 some scientist involved in the experiment concurred.The rate of mass loss from the Antarctic ice sheet does not support what seems to be your 'feeling' about the thermal inertial of the ice sheet's mass. For one the flow rate of glaciers streaming into the Amundsen Sea is not a parameter that would be checked by thermal inertia.
My "assertion" is based on data from satellite altimetry, ground-penetrating radars and direct GPS measurements of glacial flow rates. The Shokalskiy stuck in the ice was not an experiment and the scientists aboard concurred in no such thing. You are knowingly telling lies.
jc456
Diamond Member
- Dec 18, 2013
- 141,616
- 30,081
- 2,180
from a posted article
Akademik Shokalskiy rescue: tears of joy as passengers come in from the cold
Nicky Phillips Jan 2 2014 at 4:00 PM
"The official polar tourism industry body, the International Association of Antarctic Tour Operators, distanced itself from the "Spirit of Mawson" expedition."
Not sure I believe you!!!!!!! Of course you can't understand why right? That would actually involve a thought one I'm sure you can't muster up.
CrusaderFrank
Diamond Member
- May 20, 2009
- 148,642
- 71,956
- 2,330
Goebbels would be amazed by the job the AGWCult does in repeating their Big Lie
My "assertion" is based on data from satellite altimetry, ground-penetrating radars and direct GPS measurements of glacial flow rates. The Shokalskiy stuck in the ice was not an experiment and the scientists aboard concurred in no such thing. You are knowingly telling lies.
Obviously you cannot grasp sarcasm. The amazingly poor judgement shown by the organizers shows what lengths they are willing to go to in order to side with the global warming narrative. Clear evidence of danger were ignored in order to get a photo shoot opportunity. What clear evidence are they willing to ignore to push the global warming agenda?
Two Thumbs
Platinum Member
well since the Arctic ice is all gone now, it had to go somewhere.
My "assertion" is based on data from satellite altimetry, ground-penetrating radars and direct GPS measurements of glacial flow rates. The Shokalskiy stuck in the ice was not an experiment and the scientists aboard concurred in no such thing. You are knowingly telling lies.
Obviously you cannot grasp sarcasm. The amazingly poor judgement shown by the organizers shows what lengths they are willing to go to in order to side with the global warming narrative. Clear evidence of danger were ignored in order to get a photo shoot opportunity. What clear evidence are they willing to ignore to push the global warming agenda?
I don't know. Got any?
mamooth
Diamond Member
We understand conservative humor, in a manner very close to the way we understand a four-year-old boy telling toilet jokes. The question is not about "getting" conservative "sarcasm"; the question is why any adult would declare that it's great stuff.
jc456
Diamond Member
- Dec 18, 2013
- 141,616
- 30,081
- 2,180
who declared it great stuff?We understand conservative humor, in a manner very close to the way we understand a four-year-old boy telling toilet jokes. The question is not about "getting" conservative "sarcasm"; the question is why any adult would declare that it's great stuff.
jc456
Diamond Member
- Dec 18, 2013
- 141,616
- 30,081
- 2,180
Who is that?Those who believe it worth posting
Billy_Bob
Diamond Member
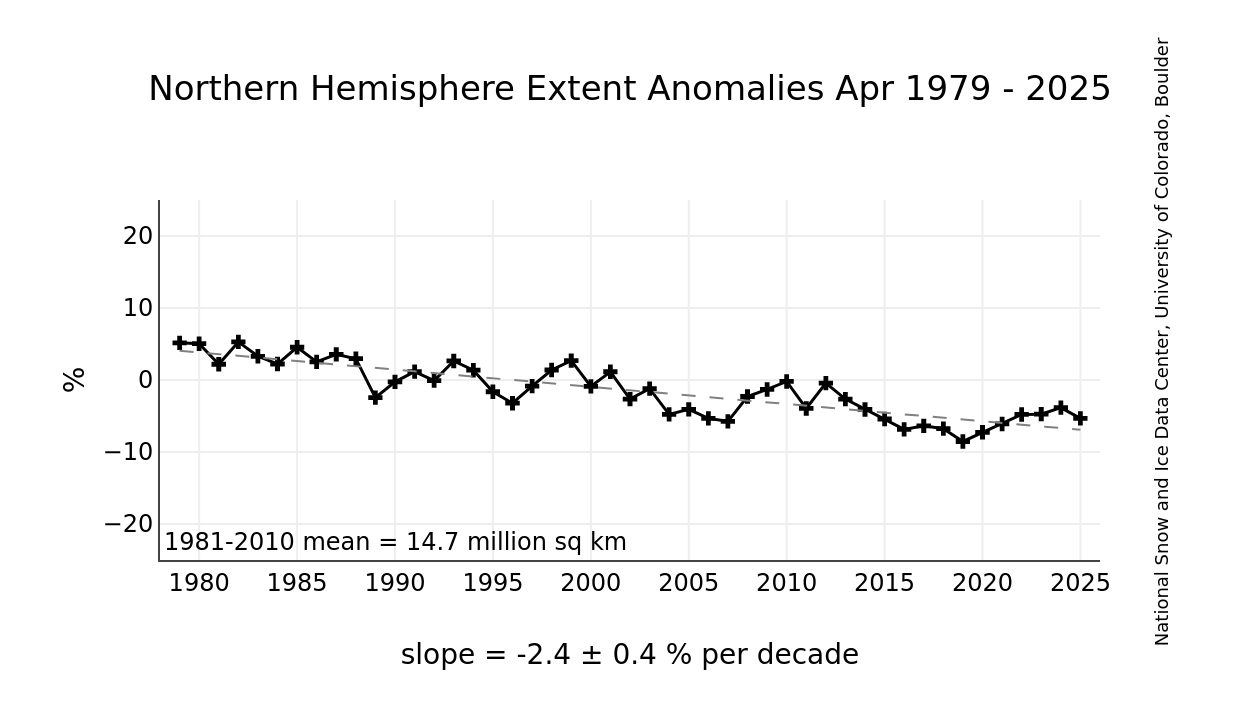
Looks like the Arctic is now the one gaining lots of ice. +2.1 % over this time last year..
Yep.. Now its growing in both hemispheres...
Billy_Bob
Diamond Member
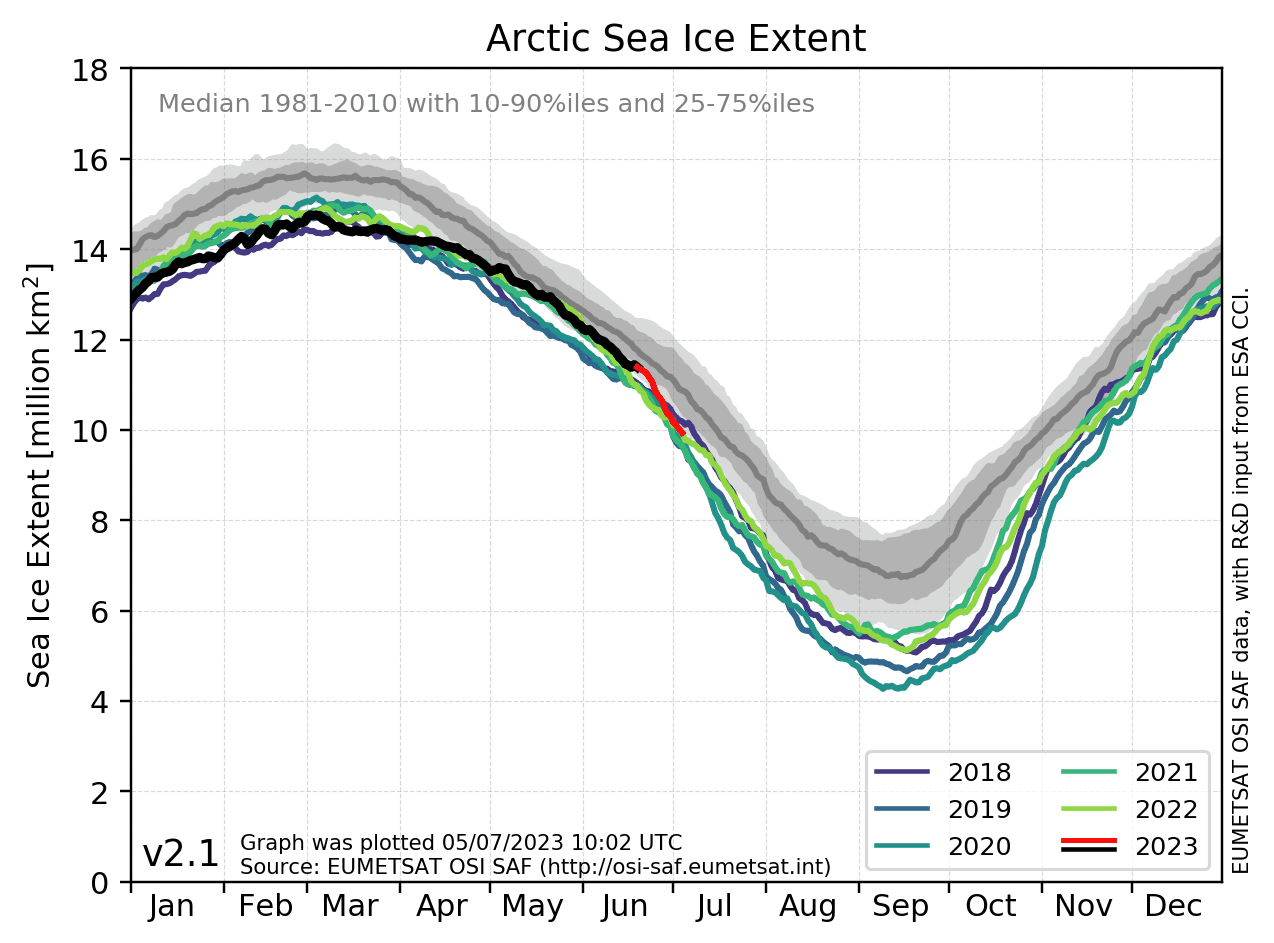
Arctic sea ice has been growing now for 14 days... 5.92 million Square KL and on the edge of +/- 2 standard deviations.. Average for recorded history!
The link at the bottom of your graphic does not work.
The data your graph display does not show any recent increase in extents. It does not show ice growing for 14 days. Ice will be growing soon, it just isn't shown in your data.
Being below 2 standard deviations of the baseline set is not a good thing.
The 2-standard deviations' grey band is not the "average for recorded history"
The standard deviation for a dataset is found by finding the arithmetic mean (the average) of all the data. Then take each individual datum and find its difference from the mean. Square those differences to make them signless, take THEIR arithmetic mean, then take the square root of that value. The result is one standard deviation of the original dataset and represents its spread around its mean. The larger its value, the more scattered is the dataset.
The grey band represents the standard deviation of some arbirtrarily defined set of Arctic ice extent data - that is, it may be the standard deviation of all data collected from January of 1979 through December of 2010 but it could be any collection of data and thus it needs to be spelled out. There are commonly used selections (like 79-2010) but older plots may only go to 2005 or 2000 and may not go back to 79 or might go back further were it available. The grey band does not include ALL data from the specified years. The red data in your graph, from 2010, is probably included in the calculation of the values plotted by the grey band.
Additionally, in data such as these, the standard deviation is often calculated for some subdivision or sector of the data. For instance, rather than calculate a standard deviation for all the data for all the years in your selected span (ex, 79-10), one might calculate the SD of all the data between 01 Jan and 15 Jan for all those years. Then the SD of all data between 16 Jan and 30 Jan for all those years. However, a more likely procedure would be to calculate a "running" value. Calculate the SD for 01-15Jan for all years; then for 02-16 Jan; then for 03-17 Jan, then for 04-18 Jan and so forth.
Given the amount of data in this example, you could also simply find the standard deviation of all the data collected on each day of the years in your set: the SD of all the 01 Jan data, the SD of all the 02 Jan data and so forth.
If one's data may be assumed to have a Gaussian (or Normal) distribution - ie, if its plot on a histogram produces the classic bell curve, there are significant resultant impacts. The set of all data falling within + 1 standard deviation of the mean of a dataset with a normal distribution will contain (or will approach containing as the number of samples rise) 68% of the data. The set of all data within two standard deviations of a normally distributed dataset will contain 95% of the sets data. Two standard deviations is commonly used to show significance when testing via the null hypothesis. Simply put, data within two standard deviations is considered to be within the confidence interval and to be representative of the data as a whole. Data outside this confidence interval is not. Keep in mind that we are not talking about confidence in the absolute value of some datum, but the likelihood - the confidence with which we might say - that a specific datum has a value falling within a given set. I probably have not explained that well.
The gist is that being below 2 SD of the current common baseline, whether or not other recent data are even worse (as they are), is a VERY strong indication that the value of the ice extent of the Arctic is shrinking.
Last edited:
Similar threads
- Replies
- 419
- Views
- 23K
- Locked
- Replies
- 67
- Views
- 4K
Latest Discussions
- Replies
- 2
- Views
- 29
- Replies
- 50
- Views
- 158
- Replies
- 17
- Views
- 152
- Replies
- 6
- Views
- 7
Forum List
-
-
-
-
-
Political Satire 8885
-
-
-
-
-
-
-
-
-
-
-
-
-
-
-
-
-
-
-
ObamaCare 781
-
-
-
-
-
-
-
-
-
-
-
Member Usernotes 492
-
-
-
-
-
-
-
-
-
-