A Single Challenge for the Denier Community

And the AGW cultists continue to push the church propaganda even though it has been shown to be bunk time and time again.

Think how much better you'd feel if you could actually lay your hands on hard evidence backing up your claims. I can and it feels great.

Then post the datasets with source code that prove CO2 drives climate.

Until you do, all you have is propaganda.
 
Can you explain this to me?

(~1.1 +0.4 W/m^2)

I'm unclear as to what it means

It is a value for the NET amount of radiant energy entering the Earth's atmosphere: the difference between what comes in and what goes out. In an equilibrium state, it would be zero. If the nomenclature is confusing: the tilde means "approximately". I put that there - my source did not use it. The value is 1.1, plus or minus 0.4. The units are watts per square meter (or watts per meter squared) . So...

Approximately one point one (plus or minus 0.4) watts per square meter.

How was this measured before they had a satellite to measure it?
 
Give us your view of what has been happening to the Earth's climate for the last 150 years and your best forecast what will happen in the next, taking into account the lack of any significant change in the Top of Atmosphere radiative imbalance (~1.1 +0.4 W/m^2). That is, take into account that the rate at which the Earth is accumulating solar energy has not changed significantly since at least 1985.

figure3-23-l.png


A few handy references if you'd like to familiarize yourself with the issue. When researching this, keep in mind that "radiative forcing" is not the same thing as the "Top of Atmosphere (ToA) radiative imbalance":

An observationally based energy balance for the Earth since 1950 - Murphy - 2009 - Journal of Geophysical Research: Atmospheres (1984?2012) - Wiley Online Library

http://www.atmos-chem-phys-discuss.net/9/24731/2009/acpd-9-24731-2009-print.pdf

https://en.wikipedia.org/wiki/Radiative_forcing

What matters is the radiative imbalance | Wotts Up With That Blog

And there are many more out there, including articles disagreeing with the IPCC observations and conclusions.

I have a better one, provide us with a repeatable experiment that shows that raising CO2 caused the increased heat. You know rather then ask us to disparage YOUR theory simply prove it to us, via the Scientific method.

I've been asking for years, all you get back from them is a cloud of squid ink as they make their escape and call you a "denier"
 
Give us your view of what has been happening to the Earth's climate for the last 150 years and your best forecast what will happen in the next, taking into account the lack of any significant change in the Top of Atmosphere radiative imbalance (~1.1 +0.4 W/m^2). That is, take into account that the rate at which the Earth is accumulating solar energy has not changed significantly since at least 1985.

figure3-23-l.png


A few handy references if you'd like to familiarize yourself with the issue. When researching this, keep in mind that "radiative forcing" is not the same thing as the "Top of Atmosphere (ToA) radiative imbalance":

An observationally based energy balance for the Earth since 1950 - Murphy - 2009 - Journal of Geophysical Research: Atmospheres (1984?2012) - Wiley Online Library

http://www.atmos-chem-phys-discuss.net/9/24731/2009/acpd-9-24731-2009-print.pdf

https://en.wikipedia.org/wiki/Radiative_forcing

What matters is the radiative imbalance | Wotts Up With That Blog

And there are many more out there, including articles disagreeing with the IPCC observations and conclusions.

I have a better one, provide us with a repeatable experiment that shows that raising CO2 caused the increased heat. You know rather then ask us to disparage YOUR theory simply prove it to us, via the Scientific method.

Then start your own thread.

For you to think no such experiment has been conducted or that no such experiment is possible - particularly considering the number of times this request of yours has already been answered - is beginning to make it look as if you just talk and never listen. There's a name for behavior like that. It begins with an S and ends with TUPID. Not the sort of behavior I'd expect from a gunny seargant.

^ "Annex II Glossary". Intergovernmental Panel on Climate Change. Retrieved 15 October 2010.
^ Jump up to: a b A concise description of the greenhouse effect is given in the Intergovernmental Panel on Climate Change Fourth Assessment Report, "What is the Greenhouse Effect?" FAQ 1.3 - AR4 WGI Chapter 1: Historical Overview of Climate Change Science, IIPCC Fourth Assessment Report, Chapter 1, page 115: "To balance the absorbed incoming [solar] energy, the Earth must, on average, radiate the same amount of energy back to space. Because the Earth is much colder than the Sun, it radiates at much longer wavelengths, primarily in the infrared part of the spectrum (see Figure 1). Much of this thermal radiation emitted by the land and ocean is absorbed by the atmosphere, including clouds, and reradiated back to Earth. This is called the greenhouse effect."
Stephen H. Schneider, in Geosphere-biosphere Interactions and Climate, Lennart O. Bengtsson and Claus U. Hammer, eds., Cambridge University Press, 2001, ISBN 0-521-78238-4, pp. 90-91.
E. Claussen, V. A. Cochran, and D. P. Davis, Climate Change: Science, Strategies, & Solutions, University of Michigan, 2001. p. 373.
A. Allaby and M. Allaby, A Dictionary of Earth Sciences, Oxford University Press, 1999, ISBN 0-19-280079-5, p. 244.
^ Jump up to: a b Wood, R.W. (1909). "Note on the Theory of the Greenhouse". Philosophical Magazine 17: 319–320. "When exposed to sunlight the temperature rose gradually to 65 °C., the enclosure covered with the salt plate keeping a little ahead of the other because it transmitted the longer waves from the Sun, which were stopped by the glass. In order to eliminate this action the sunlight was first passed through a glass plate." "it is clear that the rock-salt plate is capable of transmitting practically all of it, while the glass plate stops it entirely. This shows us that the loss of temperature of the ground by radiation is very small in comparison to the loss by convection, in other words that we gain very little from the circumstance that the radiation is trapped."
^ Jump up to: a b Schroeder, Daniel V. (2000). An introduction to thermal physics. San Francisco, California: Addison-Wesley. pp. 305–7. ISBN 0-321-27779-1. "... this mechanism is called the greenhouse effect, even though most greenhouses depend primarily on a different mechanism (namely, limiting convective cooling)."
Jump up ^ "NASA Earth Fact Sheet". Nssdc.gsfc.nasa.gov. Retrieved 2010-10-15.
Jump up ^ "Introduction to Atmospheric Chemistry, by Daniel J. Jacob, Princeton University Press, 1999. Chapter 7, "The Greenhouse Effect"". Acmg.seas.harvard.edu. Retrieved 2010-10-15.
Jump up ^ "Solar Radiation and the Earth's Energy Balance". Eesc.columbia.edu. Retrieved 2010-10-15.
^ Jump up to: a b Intergovernmental Panel on Climate Change Fourth Assessment Report. Chapter 1: Historical overview of climate change science page 97
Jump up ^ The elusive "absolute surface air temperature," see GISS discussion
Jump up ^ Vaclav Smil (2003). The Earth's Biosphere: Evolution, Dynamics, and Change. MIT Press. p. 107. ISBN 978-0-262-69298-4.
Jump up ^ IPCC AR4 WG1 (2007), Solomon, S.; Qin, D.; Manning, M.; Chen, Z.; Marquis, M.; Averyt, K.B.; Tignor, M.; and Miller, H.L., ed., Climate Change 2007: The Physical Science Basis, Contribution of Working Group I to the Fourth Assessment Report of the Intergovernmental Panel on Climate Change, Cambridge University Press, ISBN 978-0-521-88009-1 (pb: 978-0-521-70596-7)
Jump up ^ Isaac M. Held and Brian J. Soden (Nov 2000). "Water Vapor Feedback and Global Warming". Annual Review of Energy and the Environment (Annual Reviews) 25: 441–475. doi:10.1146/annurev.energy.25.1.441.
Jump up ^ John Tyndall, Heat considered as a Mode of Motion (500 pages; year 1863, 1873).
Jump up ^ Bell, Alexander Graham, Dictionary of Canadian Biography Online, 1921–1930 (Volume XV), University of Toronto and Université Laval, 2000. Retrieved March 1, 2013.
Jump up ^ Grosvenor, Edwin S. and Morgan Wesson. Alexander Graham Bell: The Life and Times of the Man Who Invented the Telephone. New York: Harry N. Abrahms, Inc., 1997, p. 274, ISBN 0-8109-4005-1.
Jump up ^ Grosvenor and Wesson, 1997, p. 269.
Jump up ^ "The HITRAN Database". Atomic and Molecular Physics Division, Harvard-Smithsonian Center for Astrophysics. Retrieved August 8, 2012. "HITRAN is a compilation of spectroscopic parameters that a variety of computer codes use to predict and simulate the transmission and emission of light in the atmosphere."
Jump up ^ "Hitran on the Web Information System". Harvard-Smithsonian Center for Astrophysics (CFA), Cambridge, MA, USA; V.E. Zuev Insitute of Atmosperic Optics (IAO), Tomsk, Russia. Retrieved August 11, 2012.
^ Jump up to: a b c Mitchell, John F. B. (1989). "THE "GREENHOUSE" EFFECT AND CLIMATE CHANGE". Reviews of Geophysics (American Geophysical Union) 27 (1): 115–139. Bibcode:1989RvGeo..27..115M. doi:10.1029/RG027i001p00115. Retrieved 2008-03-23.
Jump up ^ "Solar Radiation and Climate Experiment (SOURCE)". NASA.Gov. Retrieved 15 October 2010.
Jump up ^ "Water vapour: feedback or forcing?". RealClimate. 6 April 2005. Retrieved 2006-05-01.
^ Jump up to: a b Kiehl, J. T.; Kevin E. Trenberth (February 1997). "Earth's Annual Global Mean Energy Budget" (PDF). Bulletin of the American Meteorological Society 78 (2): 197–208. Bibcode:1997BAMS...78..197K. doi:10.1175/1520-0477(1997)078<0197:EAGMEB>2.0.CO;2. ISSN 1520-0477. Archived from the original on 2006-03-30. Retrieved 2006-05-01.
Jump up ^ "Enhanced greenhouse effect — Glossary". Nova. Australian Academy of Scihuman impact on the environment. 2006.
Jump up ^ "Enhanced Greenhouse Effect". Ace.mmu.ac.uk. Retrieved 2010-10-15.
Jump up ^ IPCC Fourth Assessment Report Synthesis Report: Summary for Policymakers (p. 5)
Jump up ^ IPCC Fourth Assessment Report, Working Group I Report "The Physical Science Basis" Chapter 7
Jump up ^ "Atmospheric Carbon Dioxide – Mauna Loa". NOAA.
Jump up ^ Climate Milestone: Earth's CO2 Level Nears 400 ppm
Jump up ^ Hansen J. (February 2005). "A slippery slope: How much global warming constitutes "dangerous anthropogenic interference"?". Climatic Change 68 (333): 269–279. doi:10.1007/s10584-005-4135-0.
Jump up ^ "Deep ice tells long climate story". BBC News. 2006-09-04. Retrieved 2010-05-04.
Jump up ^ Hileman B (2005-11-28). "Ice Core Record Extended". Chemical & Engineering News 83 (48): 7.
Jump up ^ Bowen, Mark; Thin Ice: Unlocking the Secrets of Climate in the World's Highest Mountains; Owl Books, 2005.
Jump up ^ Temperature change and carbon dioxide change, U.S. National Oceanic and Atmospheric Administration
Jump up ^ Brian Shmaefsky (2004). Favorite demonstrations for college science: an NSTA Press journals collection. NSTA Press. p. 57. ISBN 978-0-87355-242-4.
Jump up ^ Oort, Abraham H.; Peixoto, José Pinto (1992). Physics of climate. New York: American Institute of Physics. ISBN 0-88318-711-6. "...the name water vapor-greenhouse effect is actually a misnomer since heating in the usual greenhouse is due to the reduction of convection"
Jump up ^ McKay, C.; Pollack, J.; Courtin, R. (1991). "The greenhouse and antigreenhouse effects on Titan". Science 253 (5024): 1118–1121. doi:10.1126/science.11538492. PMID 11538492. edit
Jump up ^ "Titan: Greenhouse and Anti-greenhouse :: Astrobiology Magazine - earth science - evolution distribution Origin of life universe - life beyond :: Astrobiology is study of earth". Astrobio.net. Retrieved 2010-10-15.
Jump up ^ "Pluto Colder Than Expected". SPACE.com. 2006-01-03. Retrieved 2010-10-15.
Jump up ^ Kasting, James F. (1991). "Runaway and moist greenhouse atmospheres and the evolution of Earth and Venus.". Planetary Sciences: American and Soviet Research/Proceedings from the U.S.-U.S.S.R. Workshop on Planetary Sciences. Commission on Engineering and Technical Systems (CETS). pp. 234–245. Retrieved 2009.
Jump up ^ Rasool, I.; De Bergh, C.; De Bergh, C. (Jun 1970). "The Runaway Greenhouse and the Accumulation of CO2 in the Venus Atmosphere". Nature 226 (5250): 1037–1039. Bibcode:1970Natur.226.1037R. doi:10.1038/2261037a0. ISSN 0028-0836. PMID 16057644. Retrieved 02/25/2009.


Or do you think all these people are just making this stuff up?

Squid ink, not an experiment. Great that they included Saturns moon Titan in the mix
 
And yet no repeatable experiment that shows that the man made CO2 is causing the rise in temperature. Just think if you could actually link to such an experiment and show it was repeated you would win the argument.

Since you do not seem to be reading the answers I have provided you, there is no point in making further response to you. Have a good day, gunny.

Show us the lab experiment that controlled for 200ppm of CO2
 
Lush limpballs tells them all those Sceincey guys are lying.


that is all they need to know
 
what do you do with people who think 97% of people in the scientific field are just lying?


you realize they are dumb fucks and merely fight their lies so they dont get more stupid people to join them.


They don't want to go by science they choose to go by corporate propaganda.

They are just sure those people NEVER lie.

they are just that stupid

There is no 97% consensus, TM. And welcome back. It'll be fun mocking the ever living shit out of you until you get yourself vacationed again.
 
And the AGW cultists continue to push the church propaganda even though it has been shown to be bunk time and time again.

Think how much better you'd feel if you could actually lay your hands on hard evidence backing up your claims. I can and it feels great.

Then post the datasets with source code that prove CO2 drives climate.

Until you do, all you have is propaganda.

I'll post those datasets and that source code the instant you provide the blueprints to that androgofloculantic turbovascularizer in your secret sub-sub basement. And don't even try to tell me you don't have it.

The very instant
 
Last edited:
Can you explain this to me?

(~1.1 +0.4 W/m^2)

I'm unclear as to what it means

It is a value for the NET amount of radiant energy entering the Earth's atmosphere: the difference between what comes in and what goes out. In an equilibrium state, it would be zero. If the nomenclature is confusing: the tilde means "approximately". I put that there - my source did not use it. The value is 1.1, plus or minus 0.4. The units are watts per square meter (or watts per meter squared) . So...

Approximately one point one (plus or minus 0.4) watts per square meter.

How was this measured before they had a satellite to measure it?

It can be calculated from the rate of change of the total global heat content. You can get a good approximation just using ocean heat content changes - that's how large a percentage of global warming goes in to the ocean. That surface temperature increases should have slowed is trivial.
 
Can you explain this to me?

(~1.1 +0.4 W/m^2)

I'm unclear as to what it means

It is a value for the NET amount of radiant energy entering the Earth's atmosphere: the difference between what comes in and what goes out. In an equilibrium state, it would be zero. If the nomenclature is confusing: the tilde means "approximately". I put that there - my source did not use it. The value is 1.1, plus or minus 0.4. The units are watts per square meter (or watts per meter squared) . So...

Approximately one point one (plus or minus 0.4) watts per square meter.

How was this measured before they had a satellite to measure it?

mann_treering.jpg


"Right there under my pinkie...there's the evidence"
 
I answered British Patrick. It can be calculated from global heat content change and it can be estimated very closely from ocean heat content change. That alone is evidence that the amount of incoming energy that goes into the ocean is so large a proportion of the total (>90%) that the slowdown in surface warming is absolutely trivial.
 
Give us your view of what has been happening to the Earth's climate for the last 150 years and your best forecast what will happen in the next, taking into account the lack of any significant change in the Top of Atmosphere radiative imbalance (~1.1 +0.4 W/m^2). That is, take into account that the rate at which the Earth is accumulating solar energy has not changed significantly since at least 1985.

figure3-23-l.png


A few handy references if you'd like to familiarize yourself with the issue. When researching this, keep in mind that "radiative forcing" is not the same thing as the "Top of Atmosphere (ToA) radiative imbalance":

An observationally based energy balance for the Earth since 1950 - Murphy - 2009 - Journal of Geophysical Research: Atmospheres (1984?2012) - Wiley Online Library

http://www.atmos-chem-phys-discuss.net/9/24731/2009/acpd-9-24731-2009-print.pdf

https://en.wikipedia.org/wiki/Radiative_forcing

What matters is the radiative imbalance | Wotts Up With That Blog

And there are many more out there, including articles disagreeing with the IPCC observations and conclusions.

What TRENDS do you THINK you're seeing in those charts? The charts cover such a small period of time that I couldn't detect a crisis there..

If there's a 1.1W/M2 imbalance over that period -- I'll accept SOME of that. But the accounting really sucks.. What matters is -- if the TOA leakage rate to space is NOT rapidly going DOWN for LongWave radiation ---- it's NOT a CO2 problem.. Because CO2 content continues to GO UP !!!

The only trend I see is a LOWER contribution of ShortWave radiation over the last few years. THAT --- implies the cause in the principle incoming Solar irradiation.. ((For the record -- I don't see how the IPCC got a POSITIVE NET anomaly out of that --- DO YOU??? ))

And if the Earth contains MASSIVE STORAGE in the oceans and delays to establish a new thermal equilibrium temp --- from those charts alone --- I would be predicting a cooling period for the next couple decades..

Whatz the point here? You need to go back to the SOURCE of that plot

((http://www.ipcc.ch/publications_and_data/ar4/wg1/en/fig/figure3-23-l.png)) IPCC AR4 Fig3.23.1 and tell us what the IPCC is trying to assert..

To assert that you can determine the radiation balance just from observing LW and SW forcings would be to ignore the format of the Trenberth Energy diagram. The 1.1 is a MINISCULE fraction of the energy balance which includes OTHER STUFF like convection and conduction and STORAGE. (The storage part is what Trenberth MISSED --- in his original diagram)..

You can't AUDIT all this by just looking at the TOA measurements anyway. Because if the ocean is EATING your warming -- it's NOT going anywhere in terms of RADIATIVE heating ---- is it??
 
Last edited:
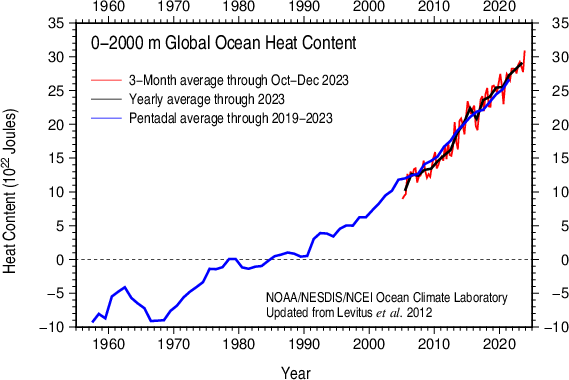
Global heat content is rising as fast as it ever did. The imbalance will remain nearly constant.
 
Global heat content is rising as fast as it ever did. The imbalance will remain nearly constant.

That's an assertion.. You think your chart PROVES THAT???

There is no historical evidence for a full 3D audit of Ocean heat that would be accurate enough to FIND those small numbers. NOTHING AT ALL before 1940s or so..

Proxy studies for SPECIFIC REGIONS in the mid ocean find MUCH HIGHER WARMING in the past 1000 yrs, but neither you or I are gonna be able to convince folks that we can compare a few isolated studies to a MODERN audit of Ocean heat..

Unless your brain is OWNED by skepticalscience that is..

Too bad your climate heroes only RECENTLY discovered that Oceans store heat.. Guess they were busy for the first couple decades giving interviews and writing IPCC fictions..
 
In the 70s we were told that the earth would soon be uninhabitable because of the cold. There would be another ice age and all of humanity would be confined to a narrow band along the equator.

No we were not. A very small number of scientists suggested based on the milankovitch cycles, that we could be heading for another ice age - full stop. No scientist made a claim that the Earth would become uninhabitable, or that "all of humanity would be confined to a narrow band along the equator".
 
Global heat content is rising as fast as it ever did. The imbalance will remain nearly constant.

That's an assertion.. You think your chart PROVES THAT???

There is no historical evidence for a full 3D audit of Ocean heat that would be accurate enough to FIND those small numbers. NOTHING AT ALL before 1940s or so..

Proxy studies for SPECIFIC REGIONS in the mid ocean find MUCH HIGHER WARMING in the past 1000 yrs, but neither you or I are gonna be able to convince folks that we can compare a few isolated studies to a MODERN audit of Ocean heat..

Unless your brain is OWNED by skepticalscience that is..

Too bad your climate heroes only RECENTLY discovered that Oceans store heat.. Guess they were busy for the first couple decades giving interviews and writing IPCC fictions..

And what the fuck have your heroes discovered lately - working deep in the secret labs at WUWT or is it the bat caves under Monckton Manor or on whatever scratchpad McIntyre adds his naughts and naughts.?

I think you'll find I quote the IPCC and the scientists whose material they use a great deal more often than I do Skeptical Science. And I'd still put Cook and Nuccitelli head and shoulders above ANYONE you've brought forward in this argument.

Here's 90% of it. If you think the whole has leveled off, we'd better have dove deep into an ice age with the remaining 10%.

Ocean_Heat_Content_%282012%29.png
 
Last edited:

Forum List

Back
Top