2011 9th Warmest Year in Satellite Record

The point was that the largest anomoly dots are where the fewest data collection stations are located and as coverage decreases the anomoly increases.

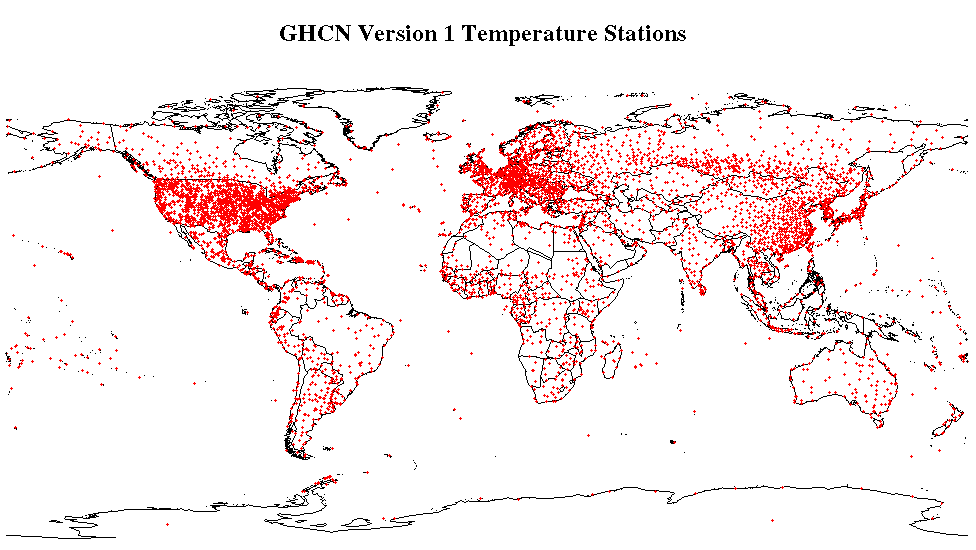
You might try getting a better image of the GCN map as well. If you look at one with decent resolution, it is clear that the areas in northern europe that are well covered are showing cooling, while areas with hardly any coverage are showing the greatest warming trends; and as coverage decreases, the anomoly increases.

Does this not raise red flags for you?

Warming: Drinking the kookaid has been proven to sharply decrease critical thinking ability.
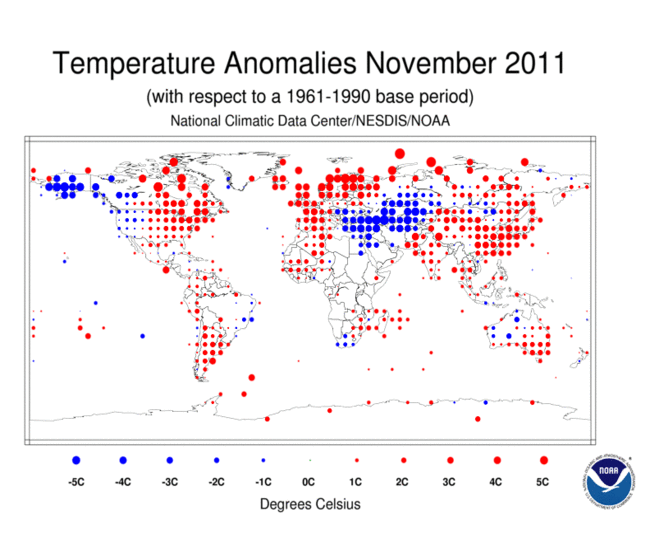
201111.gif
ndp041_temp.gif
Hey, Kaptain Kool-Aid, red means warming! It is Southwestern Europe that shows cooling! CON$ervative know-it-alls can't even read a chart! :cuckoo:
 
Well, ol' Walleyes comes out with the silly answer again. There may less weather stations in the Arctic, but they are manned by people of several differant nations. So they are all in a conspiracy to fool the rest of us? Would you like another roll of tinfoil for your little hats?


Yes, and instead of being out in the wild areas they are concentrated in the towns and airports of the Arctic. When you put blacktop in a world of white guess what happens....
 
2011 9th warmest year in satellite record | kxan.com blogs

now bent, just go to the site, and read it a couple of times. For you, maybe a couple more times. You should be able to get the accuracy, in decimal form, from that reading. Again, maybe not.

in typical fashion rocks, you failed again. You didn't answer my question and there is no answer to the question at the site.

lol


"It’s official: the Alfred Wegener Institute Antarctic Neumayer-Station III is a meteorological observation station that’s been measuring air temperature and other magnitudes in Antarctica for 30 years, which is the period of time used to define climate for a region. The results are clear and indisputable. The AWI writes in its press release:


At the Neumayer Station it has not gotten warmer over the last 30 years.”

Note they avoid saying it got cooler. If the trend had been the opposite, the results would have been blasted out to the world in the most vivid terms."


Alfred Wegener Institute Neumayer Station III: Antarctic Cooling Over The Last 30 Years!
 
Now you just stated that for the Arctic, there were too few weather stations to prove a warming, even though almost all of them did report a warming. Now you are stating that for the whole of the Antarctic Continent, you are going to go with just one station?

Walleyes, that is damned funny.

http://www.nature.com/nature/journal/v457/n7228/full/nature07669.html


Warming of the Antarctic ice-sheet surface since the 1957 International Geophysical Year

Eric J. Steig1, David P. Schneider2, Scott D. Rutherford3, Michael E. Mann4, Josefino C. Comiso5 & Drew T. Shindell6

1.Department of Earth and Space Sciences and Quaternary Research Center, University of Washington, Seattle, Washington 98195, USA
2.National Center for Atmospheric Research, Boulder, Colorado 80307, USA
3.Department of Environmental Science, Roger Williams University, Bristol, Rhode Island, USA
4.Department of Meteorology, and Earth and Environmental Systems Institute, Pennsylvania State University, University Park, Pennsylvania 16802, USA
5.NASA Laboratory for Hydrospheric and Biospheric Sciences, NASA Goddard Space Flight Center, Greenbelt, Maryland 20771, USA
6.NASA Goddard Institute for Space Studies and Center for Climate Systems Research, Columbia University, New York, New York 10025, USA
Correspondence to: Eric J. Steig1 Correspondence and requests for materials should be addressed to E.J.S. (Email: [email protected]).


Abstract

Assessments of Antarctic temperature change have emphasized the contrast between strong warming of the Antarctic Peninsula and slight cooling of the Antarctic continental interior in recent decades1. This pattern of temperature change has been attributed to the increased strength of the circumpolar westerlies, largely in response to changes in stratospheric ozone2. This picture, however, is substantially incomplete owing to the sparseness and short duration of the observations. Here we show that significant warming extends well beyond the Antarctic Peninsula to cover most of West Antarctica, an area of warming much larger than previously reported. West Antarctic warming exceeds 0.1 °C per decade over the past 50 years, and is strongest in winter and spring. Although this is partly offset by autumn cooling in East Antarctica, the continent-wide average near-surface temperature trend is positive. Simulations using a general circulation model reproduce the essential features of the spatial pattern and the long-term trend, and we suggest that neither can be attributed directly to increases in the strength of the westerlies. Instead, regional changes in atmospheric circulation and associated changes in sea surface temperature and sea ice are required to explain the enhanced warming in West Antarctica.
 
Global Warming Impact Zones | Antarctica

Because the floating ice of the West Antarctic is subject to both warming air and ocean temperatures, scientists think it is especially vulnerable to global warming. Until recently, it was thought that only coastal areas of the West Antarctic were vulnerable to melting. But satellite analysis has revealed that large inland regions are also showing signs of the impacts of warming. There is also evidence that in addition to the loss known to be occurring in West Antarctica, East Antarctica has also been losing ice since 2006.

Human activities have been identified as an important driver of Antarctic climate change, though a complex set of natural factors are also important. Rigorous analysis of temperature trends show that Antarctica has been warming at an average rate of about 0.2 °F per decade (from 1957 to 2006) or about 1°F for the last half century, roughly comparable to the warming observed for the globe as a whole. Arctic warming is expected to continue as greenhouse gas concentrations rise and the ozone hole heals.

Ice isn’t the only thing on the decline in Antarctica. As ice extent shrinks, breeding and foraging habitat for Antarctic wildlife is compromised. The population of Emporer penguins has already declined by 50 percent. Researchers studying Emporer penguins in Terre Adélie, Antarctica, estimate that by the end of the century their population will decline from 6,000 breeding pairs to an expected 400 breeding pairs under IPCC climate projections of business as usual emissions of greenhouse gases.
 
lmao......tell the people of Alaska about red dots on some dumb ass map after this past month!!!!:2up:


Fuel Arrives, but Alaska's Deep Freeze Endures - WSJ.com


U.S. NEWS
JANUARY 14, 2012
.
Fuel Arrives, but Deep Freeze Endures

Russian Tanker Churns Through Ice to Relieve Nome, Alaska, but Epic Blizzards Keep State Shivering

By JIM CARLTON

The ice-bound town of Nome will likely get its emergency fuel supply this weekend from a Russian tanker that has taken three weeks to get there, as Alaska continues to be battered by one of the state's harshest winters in decades.

The tanker Renda arrived just offshore from Nome on Friday with its cargo of fuel for the town, which was cut off from oceangoing supplies by waters that froze earlier than expected.
By early morning Friday, lights from the tanker and a Coast Guard cutter escort were visible from the community of 3,600 in western Alaska, promising relief for residents whose fuel reserves were expected to run out by March.

The Renda was originally going to arrive five days earlier, but thick ice delayed its progress. The tanker won't be able to approach closer than about a mile from shore because of an iced-in harbor, local officials said, so it will transfer 1.4 million gallons of diesel fuel and gasoline by hose to a tank facility. That task was expected to begin Saturday and take as long as three days, amid Arctic temperatures that on Friday stood at minus-31 degrees.


These Alaska stories were on Drudge for weeks...........seen by tens of millions I might add. We're all real sure people are reading this saying, "Shit......I better get my ass on the phone TODAY and call my representative and make sure they are doing something about this fucking global warming!!!"


You fucking fruitcake alarmists...........cant comprehend that almost invariably, people are not going to give a rats ass about whats going to be written on their tombstone 30 years prior to checking out. But oh.........wait........they're definately going to be shitting in their pants about potential warm weather 30 years from now after reading about Alaska being near 50 below for weeks on end:boobies::boobies::boobies::boobies::eusa_dance::eusa_dance::fu:


Yup.........ahhhhhhhhhh ( draws long draw from ciggy in classic Denis Leary style:eusa_whistle:)


6771_118856852132_640997132_2768099_7825319_n-4.jpg
 
Last edited:
Global Warming Impact Zones | Antarctica

Because the floating ice of the West Antarctic is subject to both warming air and ocean temperatures, scientists think it is especially vulnerable to global warming. Until recently, it was thought that only coastal areas of the West Antarctic were vulnerable to melting. But satellite analysis has revealed that large inland regions are also showing signs of the impacts of warming. There is also evidence that in addition to the loss known to be occurring in West Antarctica, East Antarctica has also been losing ice since 2006.

Human activities have been identified as an important driver of Antarctic climate change, though a complex set of natural factors are also important. Rigorous analysis of temperature trends show that Antarctica has been warming at an average rate of about 0.2 °F per decade (from 1957 to 2006) or about 1°F for the last half century, roughly comparable to the warming observed for the globe as a whole. Arctic warming is expected to continue as greenhouse gas concentrations rise and the ozone hole heals.

Ice isn’t the only thing on the decline in Antarctica. As ice extent shrinks, breeding and foraging habitat for Antarctic wildlife is compromised. The population of Emporer penguins has already declined by 50 percent. Researchers studying Emporer penguins in Terre Adélie, Antarctica, estimate that by the end of the century their population will decline from 6,000 breeding pairs to an expected 400 breeding pairs under IPCC climate projections of business as usual emissions of greenhouse gases.


Yes, isn't this the "rigorous study" that was proven false?
 
Global Warming Impact Zones | Antarctica

Because the floating ice of the West Antarctic is subject to both warming air and ocean temperatures, scientists think it is especially vulnerable to global warming. Until recently, it was thought that only coastal areas of the West Antarctic were vulnerable to melting. But satellite analysis has revealed that large inland regions are also showing signs of the impacts of warming. There is also evidence that in addition to the loss known to be occurring in West Antarctica, East Antarctica has also been losing ice since 2006.

Human activities have been identified as an important driver of Antarctic climate change, though a complex set of natural factors are also important. Rigorous analysis of temperature trends show that Antarctica has been warming at an average rate of about 0.2 °F per decade (from 1957 to 2006) or about 1°F for the last half century, roughly comparable to the warming observed for the globe as a whole. Arctic warming is expected to continue as greenhouse gas concentrations rise and the ozone hole heals.

Ice isn’t the only thing on the decline in Antarctica. As ice extent shrinks, breeding and foraging habitat for Antarctic wildlife is compromised. The population of Emporer penguins has already declined by 50 percent. Researchers studying Emporer penguins in Terre Adélie, Antarctica, estimate that by the end of the century their population will decline from 6,000 breeding pairs to an expected 400 breeding pairs under IPCC climate projections of business as usual emissions of greenhouse gases.


Um... Right.

If the all time record high temperature was recorded this year and it was still well below freezing, what are you proposing as the cause of the big melt that you imply is happening as a result of the runaway warming that you are implying is the cause?

Does ice melt at a lower temperature in Antarctica than in all other locations on Earth?

South Pole Records Warmest Temperature On Record | Fox News

SOUTH POLE – The South Pole recorded its highest temperature on record on Christmas Day, when temperatures reached 9.9F (-12.3C), according to the University of Wisconsin-Madison's Space Science and Engineering Center (SSEC).
While calling the new record "warm" may be going a step too far, it is positively balmy compared to June 23, 1982, when the temperature at the South Pole site reached a record low of -117F (-82.8C).
In a brief statement, the SSEC said "the prior record high temperature at South Pole was recorded on 27 December, 1978," when the mercury hit a high of 7.5F (-13.6C).
The average temperature in December at the South Pole is -15.7F (-26.5C), the Weather Underground website reported.
Records have been kept at the Amundsen-Scott South Pole site since 1957.


Read more: South Pole Records Warmest Temperature On Record | Fox News
As anyone who has a rudimentary knowledge of science would know, impurities in the water affect the freezing and boiling points of water. The melting point of ice is lowered by 1.85 degrees Celsius if 29.2 grams of salt are dissolved in each Kg of water.


Certainly if you had a never ending supply of salt to add to the water that might be an issue. However this is the salt situation in Antarctic waters....

The salinity is 34.62 parts per thousand, temperature is 28.6° F and density is 1.02789 grams per cubic centimeter.

Add to that the fact that the VAST majority of ice is continental and thus NOT IN THE WATER to be affected by salinity, renders your comment irrelevant.
Huge chunk of Antarctic ice sheet set to break free - CSMonitor.com

Typically, ice shelves are grounded against rises in the sea floor near the coast. But warm seawater has been melting the underside of Pine Island Glacier's shelf, separating the shelf's bottom from the rise and allowing the once-grounded section of the shelf to float free. This allows additional warm water to cross the top of the rise and pool behind it, melting more of the shelf's underside.
As the shelf thins from the bottom, the weaker, unanchored ice grows more vulnerable to stresses imposed by the rising and falling of the tides.
Prichard notes that this crack is forming in a general location where the shelf tends to break about once every decade. "So we'd expect to see a large iceberg [there] sometime soon," he says.
But, he adds, "it will be really interesting to see if the ice shelf recovers this time and regrows to its current size."
His research shows the ice shelf getting thinner and probably weaker over time. If it becomes smaller as well, it "would allow Pine Island Glacier to continue its trend of acceleration" and a increase its contribution to sea-level rise.

[ame=http://www.youtube.com/watch?v=2VxLfRkDcK8]Giant iceberg breaks off Antarctic glacier - YouTube[/ame]
 
2011 9th Warmest Year in Satellite Record
January 4th, 2012 at 10:16 pm by Jim Spencer under Weather
2011 9th Warmest Year in Satellite Record | KXAN.com Blogs
Global Temperature Report: December 2011

Global climate trend since Nov. 16, 1978: +0.13 C per decade

December temperatures (preliminary)

Global composite temp.: +0.13 C (about 0.23 degrees Fahrenheit) above 30-year average for December.

Northern Hemisphere: +0.20 C (about 0.36 degrees Fahrenheit) above 30-year average for December.

Southern Hemisphere: +0.06 C (about 0.11 degrees Fahrenheit) above 30-year average for December.

Tropics: +0.04 C (about 0.07 degrees Fahrenheit) above 30-year average for December.

(All temperature anomalies are based on a 30-year average (1981-2010) for the month reported.)

Notes on data released Jan. 4, 2012:

2011 was the ninth warmest year (globally averaged) in the 33-year global satellite record despite La Niña Pacific Ocean cooling events at the start and finish of the year, according to John Christy, a professor of atmospheric science and director of the Earth System Science Center (ESSC) at The University of Alabama in Huntsville. Globally averaged, Earth’s atmosphere was 0.15 C (0.27 degree Fahrenheit) warmer than the 30-year average in 2011; That was less than half of the warming anomaly seen in 2010.

Average annual global
temperature anomalies,
warmest to coolest
1979 – 2011

1998 0.424
2010 0.411
2005 0.251
2002 0.22
2009 0.187
2003 0.185
2006 0.175
2007 0.168
2011 0.15
2001 0.112
2004 0.104
1991 0.025
1987 0.018
1995 0.018
1988 0.017
1980 -0.003
1990 -0.017
1981 -0.04
2008 -0.041
1997 -0.044
1999 -0.051
1983 -0.056
2000 -0.056
1996 -0.071
1994 -0.104
1979 -0.165
1989 -0.202
1986 -0.239
1993 -0.24
1982 -0.245
1992 -0.284
1985 -0.304
1984 -0.348

With A COLDER SET UP for 2011 we got 9th, while 2008 had the 19th coldest at 2008 -0.041c. 2011 had a double nina...That hasn't happened since 1999-2001 nina cycle. The first nina in 2008 may of been close to the first one, but we didn't go below -.5c globally or even a offical second nina. This year we made -1.0 or moderate for the second nina and never warmed up at all.

This year was a impressive .191c warmer then 2008!

Ladies and gents, if this year couldn't knock us outside of the 10th warmest years-- we aren't ever going to see another in are life times. Seriously, no nina event since 1974 was as strong. Yes, sir we just faced down one of the coldest patterns in 40 years in laughed in its face! A pattern that could of put us near 1984-1985 or lower on that list.
you forgot about the satellite's the dinosaurs used to record temperatures that were much hotter than todays temps !!! WE NEED OIL COMMY !!! GET OVER IT !!!:cuckoo:
 
Tuesday, January 20, 2009


Wheels Falling Off Global Warming Bandwagon


Over the past decade the global average temperature has fallen to its lowest levels in 30 years:

1. International Falls, Minnesota -- the coldest location in the continental United States -- set a new record in January with a low temperature of minus 40 degrees and snowfall records have recently been set in 63 U.S. locations.

2. After two years of ice-cap melting in the Arctic, an abrupt turnaround occurred in 2008, with ice forming at a record pace.

3. More and more scientists are paying attention to the evidence and rejecting the link between human actions and the recent warming trend.

"The wheels are falling off the global warming bandwagon," says H. Sterling Burnett, senior fellow with the National Center for Policy Analysis. "While climate action boosters continue to call for politicians to ignore reality -- even in the face of mounting contrary evidence against catastrophic warming -- scientists, the public and politicians are wising up."


CARPE DIEM: Wheels Falling Off Global Warming Bandwagon


Of course.........the most imporant component of all this crap is what is highlighted in red above.
Oh.........it'll still be debated in the nether-reaches of the internet..........but no place else.:lol:
 
Hey, Kaptain Kool-Aid, red means warming! It is Southwestern Europe that shows cooling! CON$ervative know-it-alls can't even read a chart! :cuckoo:

Exactly Gomer. Once again, do you notice the biggest red dots claiming warming in the areas of the arctic where there are very few stations?

Hell, it's no wonder that the obvious fraud doesn't raise any flags for you.
Exactly pinhead, and did you notice there were also the FEWEST dots in the Arctic also????

201111.gif
 
Still, the stubborn fact remains, that although satellites can observe the temperature, they STILL can't tell us the CAUSE of any temperature increase.

1- So, WITH UNCOMPROMISED PROOF (no EAU Climate, NASA or Penn State data and unverified compromised surface stations), what is causing the temperature warmer this year, versus any other?

2- Can you explain how there is no possible way nature caused it without man's help?

3- Is there ANY solution that does not require threat of government force to create?

4- Can you guarantee a quantifiable, measurable result from your solution showing it's direct effect on temperatures inside a reasonable timeframe?


Just as a reminder, over 75% of this planet is covered in water and is not habitable by man. Out of the remaining <25%, less than 10% of that is urbanized. Mankind may produce billions of tons of CO2 a year, but that is still less than 0.0005% of atmospheric composition, while water vapor accounts for about 4%, and cannot be quantified or measured on it's impact, AND is a far more powerful green house gas.

The Chicken Little Chorus hasn't been able to answer these 4 questions in over 5 years of asking. Do you think you can do it?
Man... tha's a lotta crickets out there.


That's because its clear by your questions you haven't bothered to do any research on your own.

Start here:

Google Scholar
 

Forum List

Back
Top