2011 9th Warmest Year in Satellite Record

And did you bother to look at the GAO report I posted for you?
What scientific organization is the GAO? Oh that's right, they are GOP controlled government agency, and CON$ tell us that any government agency is corrupt. :lol:
 
Oh, yeah, that's the way they set up most weather stations, because the weatherman just loves giving you the wrong temperature.


I guess you don't keep up with GAO reports huh? It seems that yes indeed, the weather stations are sighted in violation of regulations all over the damned place. In front of air conditioner unit exhausts (where it's really hot), in the middle of the tarmac at airports (where you get the benefit of all that blacktop warming) etc. etc. etc.

As a physicist you certainly realise that accurate data measurement is critical to any scientific endeavor, yet when it comes to climatology all of the normal protocols go right out the window...why is that?:eusa_eh:

Why do you condone it? If you're a legit scientist?:eusa_eh:


"In choosing USHCN stations from a larger set of existing weather-monitoring stations, NOAA placed a high priority on achieving a relatively uniform geographic distribution of stations across the contiguous 48 states. NOAA balanced geographic distribution with other factors, including a desire for a long history of temperature records, limited periods of missing data, and stability of a station's location and other measurement conditions, since changes in such conditions can cause temperature shifts unrelated to climate trends. NOAA had to make certain exceptions, such as including many stations that had incomplete temperature records. In general, the extent to which the stations met NOAA's siting standards played a limited role in the designation process, in part because NOAA officials considered other factors, such as geographic distribution and a long history of records, to be more important. USHCN stations meet NOAA's siting standards and management requirements to varying degrees. According to GAO's survey of weather forecast offices, about 42 percent of the active stations in 2010 did not meet one or more of the siting standards. With regard to management requirements, GAO found that the weather forecast offices had generally but not always met the requirements to conduct annual station inspections and to update station records. NOAA officials told GAO that it is important to annually visit stations and keep records up to date, including siting conditions, so that NOAA and other users of the data know the conditions under which they were recorded. NOAA officials identified a variety of challenges that contribute to some stations not adhering to siting standards and management requirements, including the use of temperature-measuring equipment that is connected by a cable to an indoor readout device--which can require installing equipment closer to buildings than specified in the siting standards. NOAA does not centrally track whether USHCN stations adhere to siting standards and the requirement to update station records, and it does not have an agencywide policy regarding stations that do not meet its siting standards. Performance management guidelines call for using performance information to assess program results. NOAA's information systems, however, are not designed to centrally track whether stations in the USHCN meet its siting standards or the requirement to update station records. Without centrally available information, NOAA cannot easily measure the performance of the USHCN in meeting siting standards and management requirements. Furthermore, federal internal control standards call for agencies to document their policies and procedures to help managers achieve desired results. NOAA has not developed an agencywide policy, however, that clarifies for agency staff whether stations that do not adhere to siting standards should remain open because the continuity of the data is important, or should be moved or closed. As a result, weather forecast offices do not have a basis for making consistent decisions to address stations that do not meet the siting standards. GAO recommends that NOAA enhance its information systems to centrally capture information useful in managing the USHCN and develop a policy on how to address stations that do not meet its siting standards. NOAA agreed with GAO's recommendations."


U.S. GAO - Climate Monitoring: NOAA Can Improve Management of the U.S. Historical Climatology Network


K. Where does it say conclusions about the rise of global average temperatures are in question?


It doesn't. It merely states that because the siting is so poor for the majority of weather stations no real conclusion can be reached vis avis average temps because we don't have an accurate enough data set.

No determination can thus be made, so there is nothing to counter the average rise of temperature globally (which isn't truly an issue, we in the earth sciences have long said that the planet is warming up from the LIA, it just takes a real long time to get back to what the temp was before the LIA set in, it could take a 1,000 years to get back to that level) the argument is not is the planet warming up (it was, fortunately) but whether man has a part in the warming.

So far no empirical evidence has been forthcoming to support the theory of AGW. Plenty of empirical data exists to suport the natural cycle of planetary warming theory however. Plenty of it!
 
I guess you don't keep up with GAO reports huh? It seems that yes indeed, the weather stations are sighted in violation of regulations all over the damned place. In front of air conditioner unit exhausts (where it's really hot), in the middle of the tarmac at airports (where you get the benefit of all that blacktop warming) etc. etc. etc.

As a physicist you certainly realise that accurate data measurement is critical to any scientific endeavor, yet when it comes to climatology all of the normal protocols go right out the window...why is that?:eusa_eh:

Why do you condone it? If you're a legit scientist?:eusa_eh:


"In choosing USHCN stations from a larger set of existing weather-monitoring stations, NOAA placed a high priority on achieving a relatively uniform geographic distribution of stations across the contiguous 48 states. NOAA balanced geographic distribution with other factors, including a desire for a long history of temperature records, limited periods of missing data, and stability of a station's location and other measurement conditions, since changes in such conditions can cause temperature shifts unrelated to climate trends. NOAA had to make certain exceptions, such as including many stations that had incomplete temperature records. In general, the extent to which the stations met NOAA's siting standards played a limited role in the designation process, in part because NOAA officials considered other factors, such as geographic distribution and a long history of records, to be more important. USHCN stations meet NOAA's siting standards and management requirements to varying degrees. According to GAO's survey of weather forecast offices, about 42 percent of the active stations in 2010 did not meet one or more of the siting standards. With regard to management requirements, GAO found that the weather forecast offices had generally but not always met the requirements to conduct annual station inspections and to update station records. NOAA officials told GAO that it is important to annually visit stations and keep records up to date, including siting conditions, so that NOAA and other users of the data know the conditions under which they were recorded. NOAA officials identified a variety of challenges that contribute to some stations not adhering to siting standards and management requirements, including the use of temperature-measuring equipment that is connected by a cable to an indoor readout device--which can require installing equipment closer to buildings than specified in the siting standards. NOAA does not centrally track whether USHCN stations adhere to siting standards and the requirement to update station records, and it does not have an agencywide policy regarding stations that do not meet its siting standards. Performance management guidelines call for using performance information to assess program results. NOAA's information systems, however, are not designed to centrally track whether stations in the USHCN meet its siting standards or the requirement to update station records. Without centrally available information, NOAA cannot easily measure the performance of the USHCN in meeting siting standards and management requirements. Furthermore, federal internal control standards call for agencies to document their policies and procedures to help managers achieve desired results. NOAA has not developed an agencywide policy, however, that clarifies for agency staff whether stations that do not adhere to siting standards should remain open because the continuity of the data is important, or should be moved or closed. As a result, weather forecast offices do not have a basis for making consistent decisions to address stations that do not meet the siting standards. GAO recommends that NOAA enhance its information systems to centrally capture information useful in managing the USHCN and develop a policy on how to address stations that do not meet its siting standards. NOAA agreed with GAO's recommendations."


U.S. GAO - Climate Monitoring: NOAA Can Improve Management of the U.S. Historical Climatology Network


K. Where does it say conclusions about the rise of global average temperatures are in question?


It doesn't. It merely states that because the siting is so poor for the majority of weather stations no real conclusion can be reached vis avis average temps because we don't have an accurate enough data set.

I don't see where it says that.


So far no empirical evidence has been forthcoming to support the theory of AGW.

Now that's just fucking ignorant. Wow, let's just ignore the satellite record completely, for one thing. Or the known physical attributes of gaseous CO2 - fuck that, it doesn't matter. No empircal evidence - because you say so.
 
Last edited:
K. Where does it say conclusions about the rise of global average temperatures are in question?


It doesn't. It merely states that because the siting is so poor for the majority of weather stations no real conclusion can be reached vis avis average temps because we don't have an accurate enough data set.

I don't see where it says that.


So far no empirical evidence has been forthcoming to support the theory of AGW.

Now that's just fucking ignorant. Wow, let's just ignore the satellite record completely, for one thing.


Then enlighten us with some...and remember computer models are not data, no matter how many times you run the program.

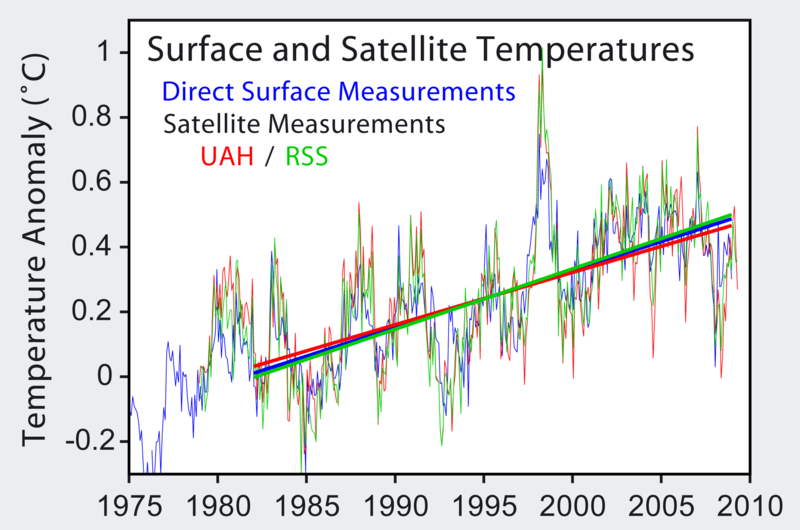
Direct surface measurement is well correlated with satellite measurement.


800px-Satellite_Temperatures.png
 
I don't see where it says that.


Now that's just fucking ignorant. Wow, let's just ignore the satellite record completely, for one thing.


Then enlighten us with some...and remember computer models are not data, no matter how many times you run the program.

Direct surface measurement is well correlated with satellite measurement.


800px-Satellite_Temperatures.png


Yeah so? Where is the evidence that man is the proximal cause? Or do you believe correlation equals causation? There is abundant evidence that it was warmer in the near history (ie the MWP and the RWP) with absolutely ZERO human input. what makes today different then then? The solar output today is very close to what it was 1500 years ago and the temps are remarkably similar to what it was then as well. In fact that graph correlates far, far better then the CO2 graphs you guys like to point to.

You're going to have to do a hell of a lot better then that dude. I mean really, if you are truly a PhD physicist I expect far better then this poor attempt.
 
K. Where does it say conclusions about the rise of global average temperatures are in question?
It doesn't. It merely states that because the siting is so poor for the majority of weather stations no real conclusion can be reached vis avis average temps because we don't have an accurate enough data set.
I don't see where it says that.
Nobody can see where it says that except for the brainwashed denier cultists, like the walleyedretard, who see everything through the distorting kaleidoscope of their deranged political ideology. They have these myths, like this one about the station placement changing the observed temperature trends, that are impervious to evidence or facts.

Hey, walleyedretard, are you really going to try to just ignore the conclusions of the BEST study that I posted earlier? LOLOLOL.

Boy, you retards sure do love to beat a dead horse. LOL. Did you block out all memory of this very recent independent study led by AGW doubter Dr. Richard Muller and partly funded by the Koch brothers?

Berkeley Earth Surface Temperature
From Wikipedia, the free encyclopedia

The team's preliminary findings, data sets and programs were made available to the public in October 2011. The study addressed scientific concerns raised by skeptics including urban heat island effect, poor station quality, and the risk of data selection bias. The Berkeley Earth group concluded that the warming trend is real, that over the past 50 years the land surface warmed by 0.911 °C, and their results mirrors those obtained from earlier studies carried out by the U.S. National Oceanic and Atmospheric Administration (NOAA), the Hadley Centre, NASA's GISS Surface Temperature Analysis, and the Climatic Research Unit (CRU) at the University of East Anglia. The study also found that The urban heat island effect and poor station quality did not bias the results obtained from these earlier studies.[7][8][9][10]

The Berkeley Earth study addressed scientific concerns raised by skeptics including urban heat island effect, poor station quality, and the risk of data selection bias. The team's initial conclusions are the following:[7][8][9][10]

* The urban heat island effect and poor station quality did not bias the results obtained from earlier studies carried out by the U.S. National Oceanic and Atmospheric Administration (NOAA), the Hadley Centre and NASA's GISS Surface Temperature Analysis. The team found that the urban heat island effect is locally large and real, but does not contribute significantly to the average land temperature rise, as the planet's urban regions amount to less than 1% of the land area. The study also found that while stations considered "poor" might be less accurate, they recorded the same average warming trend.
* Global temperatures closely matched previous studies from NASA GISS, NOAA and the Hadley Centre, that have found global warming trends. The Berkely Earth group estimates that over the past 50 years the land surface warmed by 0.911°C, just 2% less than NOAA’s estimate. The team scientific director stated that "...this confirms that these studies were done carefully and that potential biases identified by climate change sceptics did not seriously affect their conclusions."[7]


What BEST conclusion? Their papers havn't passed peer review yet. News releases are not the report, or are you completely unaware of the scientific process?
 
Then enlighten us with some...and remember computer models are not data, no matter how many times you run the program.

Direct surface measurement is well correlated with satellite measurement.


800px-Satellite_Temperatures.png


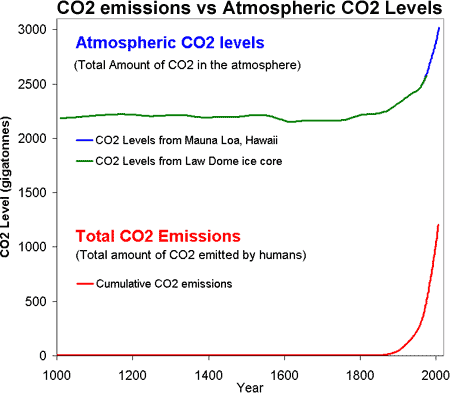
Yeah so? Where is the evidence that man is the proximal cause?

absorbspec.gif


CO2-Emissions-vs-Levels.gif


Or do you believe correlation equals causation?
Uhhh, I dunno,. what do most people say? Can I read abiout this on someone's blog?

There is abundant evidence that it was warmer in the near history (ie the MWP and the RWP) with absolutely ZERO human input.

A lot of people say there is abundant evidence of this, yes, you are right. Lots of folks say there is zero evidence of AGW. That feels right to me, lets go with it. Fuck al hockey stick gore and his SUV and methane farts, fucking hypocrite.


what makes today different then then? The solar output today is very close to what it was 1500 years ago and the temps are remarkably similar to what it was then as well. In fact that graph correlates far, far better then the CO2 graphs you guys like to point to.

THAT graph does. I've never seen it. But I'm sure you're right. I"ve heard lots of other people - some of whom have their own blogs - talk about graphs a lot, like you do, and they've come to basically the same conclusions.

You're going to have to do a hell of a lot better then that dude. I mean really, if you are truly a PhD physicist I expect far better then this poor attempt.


I'm sorry, I didn't mean to disagree with you. It was really all a joke. You've clearly got all the evidence on your side. So many people - some of who have blogs - agree with you and they talk about evidence a lot, as well, so we know they must have lots of it - why talk about it so much otherwise !!!
 
Last edited:
Direct surface measurement is well correlated with satellite measurement.


800px-Satellite_Temperatures.png


Yeah so? Where is the evidence that man is the proximal cause?

absorbspec.gif


CO2-Emissions-vs-Levels.gif


Uhhh, I dunno,. what do most people say? Can I read abiout this on someone's blog?


A lot of people say there is abundant evidence of this, yes, you are right. Lots of folks say there is zero evidence of AGW. That feels right to me, lets go with it. Fuck al hockey stick gore and his SUV and methane farts, fucking hypocrite.


what makes today different then then? The solar output today is very close to what it was 1500 years ago and the temps are remarkably similar to what it was then as well. In fact that graph correlates far, far better then the CO2 graphs you guys like to point to.

THAT graph does. I've never seen it. But I'm sure you're right. I"ve heard lots of other people - some of whom have their own blogs - talk about graphs a lot, like you do, and they've come to basically the same conclusions.

You're going to have to do a hell of a lot better then that dude. I mean really, if you are truly a PhD physicist I expect far better then this poor attempt.


I'm sorry, I didn't mean to disagree with you. It was really all a joke. You've clearly got all the evidence on your side. So many people - some of who have blogs - agree with you and they talk about evidence a lot, as well, so we know they must have lots of it - why talk about it so much otherwise !!!


It's a shame you're turning into a troll again. I had hopes for you. C'ya later spidey toober.
 
Yeah so? Where is the evidence that man is the proximal cause?

absorbspec.gif


CO2-Emissions-vs-Levels.gif


Uhhh, I dunno,. what do most people say? Can I read abiout this on someone's blog?


A lot of people say there is abundant evidence of this, yes, you are right. Lots of folks say there is zero evidence of AGW. That feels right to me, lets go with it. Fuck al hockey stick gore and his SUV and methane farts, fucking hypocrite.


THAT graph does. I've never seen it. But I'm sure you're right. I"ve heard lots of other people - some of whom have their own blogs - talk about graphs a lot, like you do, and they've come to basically the same conclusions.

You're going to have to do a hell of a lot better then that dude. I mean really, if you are truly a PhD physicist I expect far better then this poor attempt.


I'm sorry, I didn't mean to disagree with you. It was really all a joke. You've clearly got all the evidence on your side. So many people - some of who have blogs - agree with you and they talk about evidence a lot, as well, so we know they must have lots of it - why talk about it so much otherwise !!!


It's a shame you're turning into a troll again. I had hopes for you. C'ya later spidey toober.


Papers on laboratory measurements of CO2 absorption properties « AGW Observer
 
I don't see where it says that.
Nobody can see where it says that except for the brainwashed denier cultists, like the walleyedretard, who see everything through the distorting kaleidoscope of their deranged political ideology. They have these myths, like this one about the station placement changing the observed temperature trends, that are impervious to evidence or facts.

Hey, walleyedretard, are you really going to try to just ignore the conclusions of the BEST study that I posted earlier? LOLOLOL.

Boy, you retards sure do love to beat a dead horse. LOL. Did you block out all memory of this very recent independent study led by AGW doubter Dr. Richard Muller and partly funded by the Koch brothers?

Berkeley Earth Surface Temperature
From Wikipedia, the free encyclopedia

The team's preliminary findings, data sets and programs were made available to the public in October 2011. The study addressed scientific concerns raised by skeptics including urban heat island effect, poor station quality, and the risk of data selection bias. The Berkeley Earth group concluded that the warming trend is real, that over the past 50 years the land surface warmed by 0.911 °C, and their results mirrors those obtained from earlier studies carried out by the U.S. National Oceanic and Atmospheric Administration (NOAA), the Hadley Centre, NASA's GISS Surface Temperature Analysis, and the Climatic Research Unit (CRU) at the University of East Anglia. The study also found that The urban heat island effect and poor station quality did not bias the results obtained from these earlier studies.[7][8][9][10]

The Berkeley Earth study addressed scientific concerns raised by skeptics including urban heat island effect, poor station quality, and the risk of data selection bias. The team's initial conclusions are the following:[7][8][9][10]

* The urban heat island effect and poor station quality did not bias the results obtained from earlier studies carried out by the U.S. National Oceanic and Atmospheric Administration (NOAA), the Hadley Centre and NASA's GISS Surface Temperature Analysis. The team found that the urban heat island effect is locally large and real, but does not contribute significantly to the average land temperature rise, as the planet's urban regions amount to less than 1% of the land area. The study also found that while stations considered "poor" might be less accurate, they recorded the same average warming trend.
* Global temperatures closely matched previous studies from NASA GISS, NOAA and the Hadley Centre, that have found global warming trends. The Berkely Earth group estimates that over the past 50 years the land surface warmed by 0.911°C, just 2% less than NOAA’s estimate. The team scientific director stated that "...this confirms that these studies were done carefully and that potential biases identified by climate change sceptics did not seriously affect their conclusions."[7]
What BEST conclusion? Their papers havn't passed peer review yet. News releases are not the report, or are you completely unaware of the scientific process?
You're such a hoot, walleyed. What are you going to say when their papers do pass peer review and get published? What excuse will you use then to avoid giving up your idiotic myths and dogmas?

Berkeley Earth Surface Temperature

Resources

Berkeley Earth Analysis of Full Data Set (October 2011)

The Berkeley Earth team has completed the analysis of the full data set, and summary charts are available here. The Berkeley Earth team has already started to benefit from feedback from our peers, so these figures are more up-to-date than the figures in our papers submitted for peer review (see below).


Papers Submitted for Peer Review (October 2011)

The Berkeley Earth team has now submitted four papers for peer review. We are making these preliminary results public, together with our programs and data set, in order to invite additional scrutiny. The four papers are:

1.
Berkeley Earth Temperature Averaging Process
2. Influence of Urban Heating on the Global Temperature Land Average
3. Earth Atmospheric Land Surface Temperature and Station Quality in the United States
4. Decadal Variations in the Global Atmospheric Land Temperatures

- Submitted for publication in JGR Atmospheres


Berkeley Earth Land Temperature Anomaly Video (October 2011)

The Berkeley Earth team has also put together a video representation of our analysis of global land-surface temperature from 1800 to the present, available here.


Berkeley Earth Data Set (October 2011)

The Berkeley Earth data set is now publicly available here.


Berkeley Earth Analysis Programs (October 2011)

The Berkeley Earth analysis programs are now publicly available here.


Two Page Summary of Findings (October 2011)

A two page summary of the main findings is available here.


Richard Muller's testimony before congress (March 2011)

Dr. Richard Muller, chair of the Berkeley Earth Surface Temperature study, was asked to testify before the U.S. House of Representatives Committee of Science, Space and Technology at their hearing on climate change on 31 March, 2011.

A copy of Richard's testimony is available
here.


Berkeley Earth Summary Document (September 2010)

A short summary of the Berkeley Earth Surface Temperature project is available here.


Reuse Policy
The authors of the material available on the Berkeley Earth website (Home|BerkeleyEarth.org) grant permission (free of charge) to authors, readers and third parties to reproduce their materials as part of another publication or entity with proper sourcing to Berkeley Earth and by additionally providing a link to the Berkeley Earth website (Home|BerkeleyEarth.org).
 
Nobody can see where it says that except for the brainwashed denier cultists, like the walleyedretard, who see everything through the distorting kaleidoscope of their deranged political ideology. They have these myths, like this one about the station placement changing the observed temperature trends, that are impervious to evidence or facts.

Hey, walleyedretard, are you really going to try to just ignore the conclusions of the BEST study that I posted earlier? LOLOLOL.
What BEST conclusion? Their papers havn't passed peer review yet. News releases are not the report, or are you completely unaware of the scientific process?
You're such a hoot, walleyed. What are you going to say when their papers do pass peer review and get published? What excuse will you use then to avoid giving up your idiotic myths and dogmas?

Berkeley Earth Surface Temperature

Resources

Berkeley Earth Analysis of Full Data Set (October 2011)

The Berkeley Earth team has completed the analysis of the full data set, and summary charts are available here. The Berkeley Earth team has already started to benefit from feedback from our peers, so these figures are more up-to-date than the figures in our papers submitted for peer review (see below).


Papers Submitted for Peer Review (October 2011)

The Berkeley Earth team has now submitted four papers for peer review. We are making these preliminary results public, together with our programs and data set, in order to invite additional scrutiny. The four papers are:

1.
Berkeley Earth Temperature Averaging Process
2. Influence of Urban Heating on the Global Temperature Land Average
3. Earth Atmospheric Land Surface Temperature and Station Quality in the United States
4. Decadal Variations in the Global Atmospheric Land Temperatures

- Submitted for publication in JGR Atmospheres


Berkeley Earth Land Temperature Anomaly Video (October 2011)

The Berkeley Earth team has also put together a video representation of our analysis of global land-surface temperature from 1800 to the present, available here.


Berkeley Earth Data Set (October 2011)

The Berkeley Earth data set is now publicly available here.


Berkeley Earth Analysis Programs (October 2011)

The Berkeley Earth analysis programs are now publicly available here.


Two Page Summary of Findings (October 2011)

A two page summary of the main findings is available here.


Richard Muller's testimony before congress (March 2011)

Dr. Richard Muller, chair of the Berkeley Earth Surface Temperature study, was asked to testify before the U.S. House of Representatives Committee of Science, Space and Technology at their hearing on climate change on 31 March, 2011.

A copy of Richard's testimony is available
here.


Berkeley Earth Summary Document (September 2010)

A short summary of the Berkeley Earth Surface Temperature project is available here.


Reuse Policy
The authors of the material available on the Berkeley Earth website (Home|BerkeleyEarth.org) grant permission (free of charge) to authors, readers and third parties to reproduce their materials as part of another publication or entity with proper sourcing to Berkeley Earth and by additionally providing a link to the Berkeley Earth website (Home|BerkeleyEarth.org).


The peer review process is rigged for big government hockey stick lovers.

The REAL peer review happens on peoples blogs and web sites throughout the world - and in small research think tanks with one or two scientists that publish exclusively on their think tanks website.


It's a shame you're not clever enough to at least make this funny. Fail.
 
You're such a hoot, walleyed. What are you going to say when their papers do pass peer review and get published? What excuse will you use then to avoid giving up your idiotic myths and dogmas?

Berkeley Earth Surface Temperature

Resources

Berkeley Earth Analysis of Full Data Set (October 2011)

The Berkeley Earth team has completed the analysis of the full data set, and summary charts are available here. The Berkeley Earth team has already started to benefit from feedback from our peers, so these figures are more up-to-date than the figures in our papers submitted for peer review (see below).


Papers Submitted for Peer Review (October 2011)

The Berkeley Earth team has now submitted four papers for peer review. We are making these preliminary results public, together with our programs and data set, in order to invite additional scrutiny. The four papers are:

1.
Berkeley Earth Temperature Averaging Process
2. Influence of Urban Heating on the Global Temperature Land Average
3. Earth Atmospheric Land Surface Temperature and Station Quality in the United States
4. Decadal Variations in the Global Atmospheric Land Temperatures

- Submitted for publication in JGR Atmospheres


Berkeley Earth Land Temperature Anomaly Video (October 2011)

The Berkeley Earth team has also put together a video representation of our analysis of global land-surface temperature from 1800 to the present, available here.


Berkeley Earth Data Set (October 2011)

The Berkeley Earth data set is now publicly available here.


Berkeley Earth Analysis Programs (October 2011)

The Berkeley Earth analysis programs are now publicly available here.


Two Page Summary of Findings (October 2011)

A two page summary of the main findings is available here.


Richard Muller's testimony before congress (March 2011)

Dr. Richard Muller, chair of the Berkeley Earth Surface Temperature study, was asked to testify before the U.S. House of Representatives Committee of Science, Space and Technology at their hearing on climate change on 31 March, 2011.

A copy of Richard's testimony is available
here.


Berkeley Earth Summary Document (September 2010)

A short summary of the Berkeley Earth Surface Temperature project is available here.


Reuse Policy
The authors of the material available on the Berkeley Earth website (Home|BerkeleyEarth.org) grant permission (free of charge) to authors, readers and third parties to reproduce their materials as part of another publication or entity with proper sourcing to Berkeley Earth and by additionally providing a link to the Berkeley Earth website (Home|BerkeleyEarth.org).


The peer review process is rigged for big government hockey stick lovers.

The REAL peer review happens on peoples blogs and web sites throughout the world - and in small research think tanks with one or two scientists that publish exclusively on their think tanks website.
It's a shame you're not clever enough to at least make this funny. Fail.
Actually, walleyed, it is you who makes this funny by doing it for real. It is even funnier that you're too dense to realize when you're being mocked.
 
Last edited:
The peer review process is rigged for big government hockey stick lovers.

The REAL peer review happens on peoples blogs and web sites throughout the world - and in small research think tanks with one or two scientists that publish exclusively on their think tanks website.
It's a shame you're not clever enough to at least make this funny. Fail.
Actually, walleyed, it is you who makes this funny by doing it for real. It is even funnier that you're too dense to realize when you're being mocked.


C0110_Bob_Rohrman.jpg


And actually.......the so-called "retards" you refer to...........are not.:dance:

In fact, the nutters are getting their clocks cleaned out in the real world.....not even debatable!!!:lol:
 
It's a shame you're not clever enough to at least make this funny. Fail.
Actually, walleyed, it is you who makes this funny by doing it for real. It is even funnier that you're too dense to realize when you're being mocked.
And actually.......the so-called "retards" you refer to...........are not.
In fact, the nutters are getting their clocks cleaned out in the real world.....not even debatable!!!

You live in your own little retarded fantasy world, kooker, and you lost all connection with reality long ago.
 
Direct surface measurement is well correlated with satellite measurement.


800px-Satellite_Temperatures.png


Yeah so? Where is the evidence that man is the proximal cause?

absorbspec.gif


CO2-Emissions-vs-Levels.gif


Uhhh, I dunno,. what do most people say? Can I read abiout this on someone's blog?


A lot of people say there is abundant evidence of this, yes, you are right. Lots of folks say there is zero evidence of AGW. That feels right to me, lets go with it. Fuck al hockey stick gore and his SUV and methane farts, fucking hypocrite.


what makes today different then then? The solar output today is very close to what it was 1500 years ago and the temps are remarkably similar to what it was then as well. In fact that graph correlates far, far better then the CO2 graphs you guys like to point to.

THAT graph does. I've never seen it. But I'm sure you're right. I"ve heard lots of other people - some of whom have their own blogs - talk about graphs a lot, like you do, and they've come to basically the same conclusions.

You're going to have to do a hell of a lot better then that dude. I mean really, if you are truly a PhD physicist I expect far better then this poor attempt.


I'm sorry, I didn't mean to disagree with you. It was really all a joke. You've clearly got all the evidence on your side. So many people - some of who have blogs - agree with you and they talk about evidence a lot, as well, so we know they must have lots of it - why talk about it so much otherwise !!!


Take a look at your graph of the level of CO2 and note when the CO2 starts to increase.

Take a look at the graph of proxy temps in the link below. You will note the that the first glimmers of warming show up in about 1575. The rest swing in by about 1650. Now, note when the CO2 starts to rise in your graph. The real increase in CO2 seems to be closer to about 1800 to 1850.

If you are saying that increasing CO2 causes increases warming, you are arguing that the future causes the past.

File:1000 Year Temperature Comparison.png - Global Warming Art
 
Last edited:
Yeah so? Where is the evidence that man is the proximal cause?

absorbspec.gif


CO2-Emissions-vs-Levels.gif


Uhhh, I dunno,. what do most people say? Can I read abiout this on someone's blog?

A lot of people say there is abundant evidence of this, yes, you are right. Lots of folks say there is zero evidence of AGW. That feels right to me, lets go with it. Fuck al hockey stick gore and his SUV and methane farts, fucking hypocrite.

THAT graph does. I've never seen it. But I'm sure you're right. I"ve heard lots of other people - some of whom have their own blogs - talk about graphs a lot, like you do, and they've come to basically the same conclusions.
You're going to have to do a hell of a lot better then that dude. I mean really, if you are truly a PhD physicist I expect far better then this poor attempt.
I'm sorry, I didn't mean to disagree with you. It was really all a joke. You've clearly got all the evidence on your side. So many people - some of who have blogs - agree with you and they talk about evidence a lot, as well, so we know they must have lots of it - why talk about it so much otherwise !!!

Take a look at your graph of the level of CO2 and note when the CO2 starts to increase.

Take a look at the graph of proxy temps in the link below. You will note the that the first glimmers of warming show up in about 1575. The rest swing in by about 1650. Now, note when the CO2 starts to rise in your graph. The real increase in CO2 seems to be closer to about 1800 to 1850.

If you are saying that increasing CO2 causes increases warming, you are arguing that the future causes the past.

File:1000 Year Temperature Comparison.png - Global Warming Art

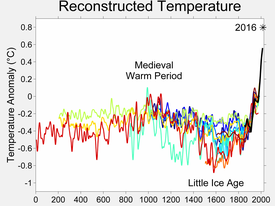
LOLOLOL......oh, code4stupid, your silly logic is soooo retarded and you must pull your backward "facts(?)" out of your ass. I thought all of you denier cultists were obsessed with the Little Ice Age and the Medieval Warm Period. You say warming started "in about 1575" but that is actually about the start of the Little Ice Age. You say it got going "by about 1650" but that is the coldest middle part of the Little Ice Age. Even the temperature chart you linked to shows that. Here's another one that might make it clearer to you.

275px-2000_Year_Temperature_Comparison.png


The Little Ice Age (LIA) was caused by some combination of natural factors (discussed below) and affected some parts of the world more than others. After the mid 1800's the temperature patterns were returning to the normal range the world had mostly been in for the previous six thousand years. Some scientists think that mankind's activities, like deforestation, had already been affecting the climate for centuries but in the 1800's we began to really pump long sequestered fossil CO2 into the atmosphere at ever higher rates and began the abrupt and accelerating global warming trend that has been observed since.

Little Ice Age
From Wikipedia, the free encyclopedia

The Little Ice Age (LIA) was a period of cooling that occurred after the Medieval Warm Period (Medieval Climate Optimum).[1] While not a true ice age, the term was introduced into the scientific literature by François E. Matthes in 1939.[2] It is conventionally defined as a period extending from the 16th to the 19th centuries,[3][4][5] though climatologists and historians working with local records no longer expect to agree on either the start or end dates of this period, which varied according to local conditions. NASA defines the term as a cold period between 1550 AD and 1850 AD and notes three particularly cold intervals: one beginning about 1650, another about 1770, and the last in 1850, each separated by intervals of slight warming.[6]

Causes

Solar activity

There is still a very poor understanding of the correlation between low sunspot activity and cooling temperatures.[58][59] During the period 1645–1715, in the middle of the Little Ice Age, there was a period of low solar activity known as the Maunder Minimum. The Spörer Minimum has also been identified with a significant cooling period between 1460 and 1550.[60] Other indicators of low solar activity during this period are levels of the isotopes carbon-14 and beryllium-10.[61]


Volcanic activity

Throughout the Little Ice Age, the world experienced heightened volcanic activity.[62] When a volcano erupts, its ash reaches high into the atmosphere and can spread to cover the whole earth. This ash cloud blocks out some of the incoming solar radiation, leading to worldwide cooling that can last up to two years after an eruption. Also emitted by eruptions is sulfur in the form of sulfur dioxide gas. When this gas reaches the stratosphere, it turns into sulfuric acid particles, which reflect the sun's rays, further reducing the amount of radiation reaching Earth's surface. The 1815 eruption of Tambora in Indonesia blanketed the atmosphere with ash; the following year, 1816, came to be known as the Year Without a Summer, when frost and snow were reported in June and July in both New England and Northern Europe. Other volcanoes that erupted during the era and may have contributed to the cooling include Billy Mitchell (ca. 1580), Mount Parker (1641), Long Island (Papua New Guinea) (ca. 1660), and Huaynaputina (1600).[15]


Ocean Conveyor slowdown

Another possibility is that there was a slowing of thermohaline circulation.[24][63][64] The circulation could have been interrupted by the introduction of a large amount of fresh water into the North Atlantic, possibly caused by a period of warming before the Little Ice Age known as the Medieval Warm Period.[65][66][67] There is some concern that a shutdown of thermohaline circulation could happen again as a result of the present warming period.[68][69]


Decreased human populations

Some researchers have proposed that human influences on climate began earlier than is normally supposed and that major population declines in Eurasia and the Americas reduced this impact, leading to a cooling trend. William Ruddiman has proposed that somewhat reduced populations of Europe, East Asia, and the Middle East during and after the Black Death caused a decrease in agricultural activity. He suggests reforestation took place, allowing more carbon dioxide uptake from the atmosphere, which may have been a factor in the cooling noted during the Little Ice Age. Ruddiman further hypothesizes that a reduced population in the Americas after European contact in the early 16th century could have had a similar effect.[70][71] A 2008 study of sediment cores and soil samples further suggests that carbon dioxide uptake via reforestation in the Americas could have contributed to the Little Ice Age.[72] Faust, Gnecco, Mannstein and Stamm (2005) supported depopulation in the Americas as a factor, asserting that humans had cleared considerable amounts of forests to support agriculture in the Americas before the arrival of Europeans brought on a population collapse.[73] The authors link the subsequent depopulation to a drop in carbon dioxide levels observed at Law Dome, Antarctica.[73]
 
absorbspec.gif


CO2-Emissions-vs-Levels.gif


Uhhh, I dunno,. what do most people say? Can I read abiout this on someone's blog?

A lot of people say there is abundant evidence of this, yes, you are right. Lots of folks say there is zero evidence of AGW. That feels right to me, lets go with it. Fuck al hockey stick gore and his SUV and methane farts, fucking hypocrite.

THAT graph does. I've never seen it. But I'm sure you're right. I"ve heard lots of other people - some of whom have their own blogs - talk about graphs a lot, like you do, and they've come to basically the same conclusions.
I'm sorry, I didn't mean to disagree with you. It was really all a joke. You've clearly got all the evidence on your side. So many people - some of who have blogs - agree with you and they talk about evidence a lot, as well, so we know they must have lots of it - why talk about it so much otherwise !!!

Take a look at your graph of the level of CO2 and note when the CO2 starts to increase.

Take a look at the graph of proxy temps in the link below. You will note the that the first glimmers of warming show up in about 1575. The rest swing in by about 1650. Now, note when the CO2 starts to rise in your graph. The real increase in CO2 seems to be closer to about 1800 to 1850.

If you are saying that increasing CO2 causes increases warming, you are arguing that the future causes the past.

File:1000 Year Temperature Comparison.png - Global Warming Art

LOLOLOL......oh, code4stupid, your silly logic is soooo retarded and you must pull your backward "facts(?)" out of your ass. I thought all of you denier cultists were obsessed with the Little Ice Age and the Medieval Warm Period. You say warming started "in about 1575" but that is actually about the start of the Little Ice Age. You say it got going "by about 1650" but that is the coldest middle part of the Little Ice Age. Even the temperature chart you linked to shows that. Here's another one that might make it clearer to you.

275px-2000_Year_Temperature_Comparison.png


The Little Ice Age (LIA) was caused by some combination of natural factors (discussed below) and affected some parts of the world more than others. After the mid 1800's the temperature patterns were returning to the normal range the world had mostly been in for the previous six thousand years. Some scientists think that mankind's activities, like deforestation, had already been affecting the climate for centuries but in the 1800's we began to really pump long sequestered fossil CO2 into the atmosphere at ever higher rates and began the abrupt and accelerating global warming trend that has been observed since.

Little Ice Age
From Wikipedia, the free encyclopedia

The Little Ice Age (LIA) was a period of cooling that occurred after the Medieval Warm Period (Medieval Climate Optimum).[1] While not a true ice age, the term was introduced into the scientific literature by François E. Matthes in 1939.[2] It is conventionally defined as a period extending from the 16th to the 19th centuries,[3][4][5] though climatologists and historians working with local records no longer expect to agree on either the start or end dates of this period, which varied according to local conditions. NASA defines the term as a cold period between 1550 AD and 1850 AD and notes three particularly cold intervals: one beginning about 1650, another about 1770, and the last in 1850, each separated by intervals of slight warming.[6]

Causes

Solar activity

There is still a very poor understanding of the correlation between low sunspot activity and cooling temperatures.[58][59] During the period 1645–1715, in the middle of the Little Ice Age, there was a period of low solar activity known as the Maunder Minimum. The Spörer Minimum has also been identified with a significant cooling period between 1460 and 1550.[60] Other indicators of low solar activity during this period are levels of the isotopes carbon-14 and beryllium-10.[61]


Volcanic activity

Throughout the Little Ice Age, the world experienced heightened volcanic activity.[62] When a volcano erupts, its ash reaches high into the atmosphere and can spread to cover the whole earth. This ash cloud blocks out some of the incoming solar radiation, leading to worldwide cooling that can last up to two years after an eruption. Also emitted by eruptions is sulfur in the form of sulfur dioxide gas. When this gas reaches the stratosphere, it turns into sulfuric acid particles, which reflect the sun's rays, further reducing the amount of radiation reaching Earth's surface. The 1815 eruption of Tambora in Indonesia blanketed the atmosphere with ash; the following year, 1816, came to be known as the Year Without a Summer, when frost and snow were reported in June and July in both New England and Northern Europe. Other volcanoes that erupted during the era and may have contributed to the cooling include Billy Mitchell (ca. 1580), Mount Parker (1641), Long Island (Papua New Guinea) (ca. 1660), and Huaynaputina (1600).[15]


Ocean Conveyor slowdown

Another possibility is that there was a slowing of thermohaline circulation.[24][63][64] The circulation could have been interrupted by the introduction of a large amount of fresh water into the North Atlantic, possibly caused by a period of warming before the Little Ice Age known as the Medieval Warm Period.[65][66][67] There is some concern that a shutdown of thermohaline circulation could happen again as a result of the present warming period.[68][69]


Decreased human populations

Some researchers have proposed that human influences on climate began earlier than is normally supposed and that major population declines in Eurasia and the Americas reduced this impact, leading to a cooling trend. William Ruddiman has proposed that somewhat reduced populations of Europe, East Asia, and the Middle East during and after the Black Death caused a decrease in agricultural activity. He suggests reforestation took place, allowing more carbon dioxide uptake from the atmosphere, which may have been a factor in the cooling noted during the Little Ice Age. Ruddiman further hypothesizes that a reduced population in the Americas after European contact in the early 16th century could have had a similar effect.[70][71] A 2008 study of sediment cores and soil samples further suggests that carbon dioxide uptake via reforestation in the Americas could have contributed to the Little Ice Age.[72] Faust, Gnecco, Mannstein and Stamm (2005) supported depopulation in the Americas as a factor, asserting that humans had cleared considerable amounts of forests to support agriculture in the Americas before the arrival of Europeans brought on a population collapse.[73] The authors link the subsequent depopulation to a drop in carbon dioxide levels observed at Law Dome, Antarctica.[73]


So explain why the warming pre dates the industrial revolution.
 

Forum List

Back
Top