What is the IPCC

Frank... I often have a hard time, understanding how you can assemble some comment to make without doing a little more BASIC thinking first.

A comet might be seen everywhere on the globe as it passes by. That does not make a single person looking up and seeing it a global event. Just because A is included in B does not mean that every part of B is A.

And yet Mann and his little graph is taken from a SINGLE tree in Russia, and suddenly you want us to ascribe global valuation for that. Too funny. The IPCC got over a decade of propaganda from that ONE single little tree.

Prove it


Already done, multiple times. You're long on tough talk, but real short on everything else. The IPCC is now a laughing stock. It has been exposed as nothing more than a purveyor of fraudulent studies, the majority of which we have found out are promulgated by activists and not peer reviewed by anyone save their bankers who wish for more cash.
 
Frank... I often have a hard time, understanding how you can assemble some comment to make without doing a little more BASIC thinking first.

A comet might be seen everywhere on the globe as it passes by. That does not make a single person looking up and seeing it a global event. Just because A is included in B does not mean that every part of B is A.
still doesn't answer how seven feet of snow in Boston is local and a flood in Texas is global. Tell me please how that is?

Having never made any such claims, I cannot help you. I don't even know what they mean. Why don't you start by explaining what you mean when you say one event was local and the other was global.
 
Frank... I often have a hard time, understanding how you can assemble some comment to make without doing a little more BASIC thinking first.

A comet might be seen everywhere on the globe as it passes by. That does not make a single person looking up and seeing it a global event. Just because A is included in B does not mean that every part of B is A.

And yet Mann and his little graph is taken from a SINGLE tree in Russia, and suddenly you want us to ascribe global valuation for that. Too funny. The IPCC got over a decade of propaganda from that ONE single little tree.

Prove it

Already done, multiple times. You're long on tough talk, but real short on everything else. The IPCC is now a laughing stock. It has been exposed as nothing more than a purveyor of fraudulent studies, the majority of which we have found out are promulgated by activists and not peer reviewed by anyone save their bankers who wish for more cash.

Bullshit. You've never proven ANY of your claims.


Prove it!
 
And when the source is located, perhaps he could be queried as to how he came to know the reason Keeling rejected those CO2 sources. I mean, besides the reasons he (Keeling) gave in his published papers.

I'm also curious how, for instance, a single measurement from 1820 gives global values.

Pretty much the same way that readings from Mauna Loa are CURRENTLY interpreted to be Global readings son... It's assumed to be a well mixed homogenous quantity. There ARE local variations. But not in the middle of Pacific Ocean on top of a mountain.

U Think???

BTW: the Annual variation at MaunaLoa is about 5 years of "climb" in the general long-term rate.
Where does that comes from Crickham? Of course -- TEMPERATURE changes cause variation in CO2... But not temperature changes in the realm of 0.5degC.. Mother Nature is cranking out about 5 years worth of man-caused CO2 atmos concentration from the Oceans every summer.


The Keeling Curve is not a single value Ian.
 
Frank... I often have a hard time, understanding how you can assemble some comment to make without doing a little more BASIC thinking first.

A comet might be seen everywhere on the globe as it passes by. That does not make a single person looking up and seeing it a global event. Just because A is included in B does not mean that every part of B is A.

And yet Mann and his little graph is taken from a SINGLE tree in Russia, and suddenly you want us to ascribe global valuation for that. Too funny. The IPCC got over a decade of propaganda from that ONE single little tree.

Prove it

Already done, multiple times. You're long on tough talk, but real short on everything else. The IPCC is now a laughing stock. It has been exposed as nothing more than a purveyor of fraudulent studies, the majority of which we have found out are promulgated by activists and not peer reviewed by anyone save their bankers who wish for more cash.

Bullshit. You've never proven ANY of your claims.

Prove it!

You're right. I can't assume I've seen every piece of shite you've ever posted. Instead, I will say

I HAVE NEVER SEEN YOU PROVE A SINGLE ONE OF YOUR CLAIMS REGARDING AGW.

Which is not falsifiable, but it could easily be made worthless by you giving us a link to a single instance in which you PROVED that MBH 98 comes from a single tree.
 
I'm going to be waiting here for quite some time, aren't I. You've had a look and realize you stuck your foot in your mouth, haven't you. Shame.
 
I'm going to be waiting here for quite some time, aren't I. You've had a look and realize you stuck your foot in your mouth, haven't you. Shame.
The same post can be made back at you. Well?
 
. Mother Nature is cranking out about 5 years worth of man-caused CO2 atmos concentration from the Oceans every summer.

Check it out. Flac has become a Henry's Law denier.

Flac, we'll all be fascinated to hear how a solution that isn't yet in equilibrium with the atmosphere loses a soluble gas instead of gaining it. Can you explain the mechanism?

I'm sure the OCO-2 satellite will soon show the oceans burping CO2. Oh wait, we've already seen the data, and it showed no such thing. By the flac theory, that OCO-2 Fall 2014 image should have showed CO2 pouring out of the very warm northern oceans. But it didn't.

If they didn't show the large annual variation in CO2 coming from the oceans --- then they must be broken. Other CO2 measuring techniques clearly show it. You should think a bit before you engage on this. I never inferred that the annual variations were a substitute for the net long term flow from/to the oceans.

But GLOBALLY and ANNUALLY the oceans give up about 10 times more than mankind does (land and ocean -- 20 times). They also absorb. And you miss the significance of the HUGE numbers for CO2 exchange from the oceans every day of the year somewhere on the globe which can been seen on the gauges at Mauna Loa and elsewhere --- when you only look at the net exchanges on a global yearly basis. .
 
The Mauna Loa data is plotted at least monthly.

Mauna_Loa_Carbon_Dioxide.png
 
W
The Mauna Loa data is plotted at least monthly.

Mauna_Loa_Carbon_Dioxide.png
What does it mean?

That the Mauna Loa CO2 data is not the mess FCT would like us to believe it is.

Where did I say that? BTW -- What is the diff between the RED graph and Blue graph on that chart? __(Graphs for $400 Alex)___

How many years of CO2 "climb" would be equal to the annual variation on there?
 
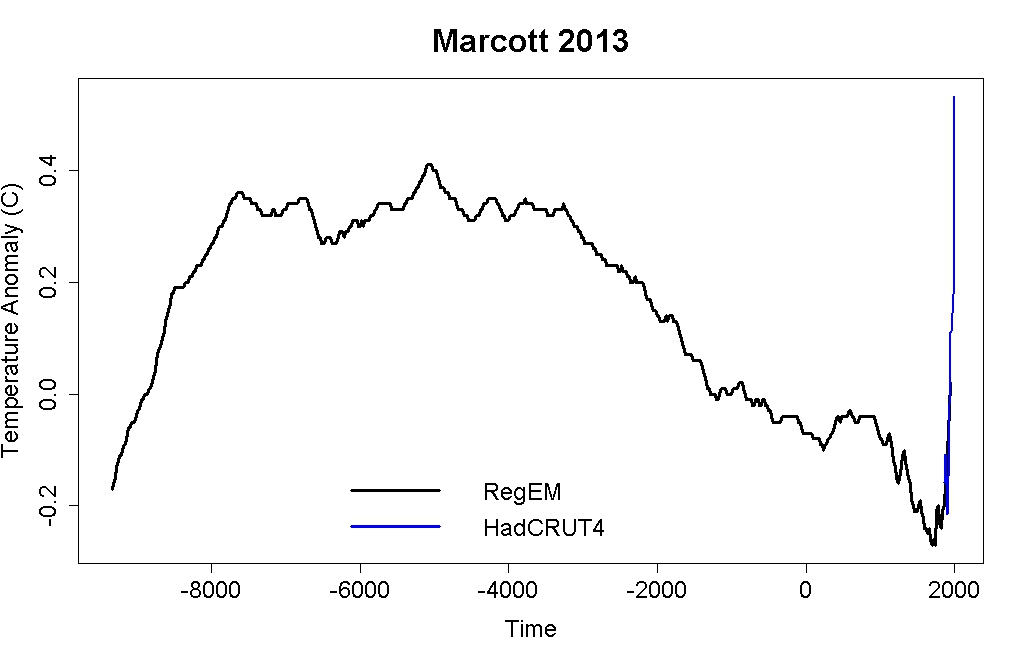
You are so full of Bullwinkle, I got my tractor shoes on. BOTH the Mann study and the Marcott study are "hockey sticks"

Marcott 2013. Does this look like a hockey stick to anyone out there?

regemcrufull.jpg

And do note - if you're suddenly ready to join up with the rest of western civilizationas to what constitutes the defining characteristic of a hockey stick - that the spike on the right end is clearly identified as being HadCRUT4 and not Marcott.

. Let's remove all of OUR subjective analysis and listen to how Marcott compared their results to the Mann results in the paper that accompanied their work..

Let s play hockey again Climate Etc.

Yes, let's be completely objective by going to the Queen of Deniers. But don't fret about it. I would have expected no less from you.

The paper contains a comparison in Figure 1B to a version of the TAR hockey stick chart in which the Medieval Warm Period (MWP) disappeared, and ‘Mike’s Nature trick’ was used to ‘hide the [recent proxy] decline’ by pasting in thermometer temperatures. The paper found good agreement of their reconstruction with Mann et al.’s previous reconstructions: indistiguishable within uncertainty”.

And what, precisely is your complaint? His proxy data lines up with newer proxy data and modern instrument data. You've got a problem with that?

The difference between them is that Marcott/Shakun made their process more transparent and Marcott later publicly acknowledged that his work had limitations in it that would make the "unprecendented warming" claim invalid (laughable), whereas Mann is a unrepentant fraud and BullWinkle artist who got caught fudging his cut and paste propaganda piece and juggling tree rings to force a result.

Marcott, Shakun and Mann have all produced excellent work. Certainly better than anything folks on your side have put out. For that matter, has anyone on YOUR side of the argument EVER put out data covering a similar period? And, your ability to accurately quote is questionable. Marcott never said that modern temperature trends were unprecedented in the Holocene. He said they were unprecedented in the last 1500 years, and they are. The pertinent line from Marcott's abstract states "Current global temperatures of the past decade have not yet exceeded peak interglacial values but are warmer than during ~75% of the Holocene temperature history.". You need to stop lying.

Whatever this "instrumented data" is that you think Mann used that makes his shady work more viable is a figment of your imagination...

So, you don't understand a simple data graph.

The link I gave goes on to say...

That is, Judith Curry goes on to say...

How has the MWP almost disappeared again, just in time to perhaps go missing in IPCC AR5? Science’ supplemental information says the average resolution of the 73 paleoclimate series is 160 years, and the median is 120.
The proxy selection was deliberately weighted toward ‘low frequency’ resolution, since the entire Holocene was being assessed. Figure S18c (below) shows there is no statistically valid resolution to the combined proxy set for anything less than 300-year periods. [“Gain” was defined as the ratio of output variance to input white noise in simulations ‘stressing’ combined proxy statistical reliability. In other words, for periods less than three hundred years, white noise in is white noise out (no matter whether the Monte Carlo sampling interval is 20 or 120 years) while for periods over 2000 years the output is about 90% ‘valid’ signal.] The paper itself said, “…our temperature stack does not fully resolve variability at periods shorter than 2000 years…”

Bless their little hearts (Marcott/Shakun) for admitting that their paper was misinterpreted by the AGW regime. At least they WARNED the folks who cared to check on the details..

Mann et al simply didn't care about being used as a tool.. Those days are over Rover.

It apparently doesn't matter to you whether someone is correct or mistaken, whether they are telling the truth or lying. If they present information supportive of AGW, you will attack them. If they attack AGW, you will accept them. And you accuse me ignoring conflicting evidence. You are truly pathetic.


first things first. I see that you are attributing the guest posting at Curry's site to her, again. what is wrong with you? we went through this before when you put Zeke's words into her mouth. dont you ever learn?

this was what she said -

JC comment: This post was emailed to me, unsolicited. I did some editing and checking (I have read the main article but not the supplementary material). I have not personally spent much time on this paper, but I think it is a paper that should be discussed, given the hypberbolic press coverage.

Andy Revkin has a post on the paper, with extensive quotes from Mann, Rohde, and Alley, worth reading.

Hank at suyts has a post on the paper, where he downloaded the data made available by the authors and analyzed it. This post is worth reading also.

There doesn’t seem to be anything really new here in terms of our understanding of the Holocene. Mike’s Nature trick seems to be now a standard practice in paleo reconstructions. I personally don’t see how this analysis says anything convincing about climate variability on the time scale of a century.

her inserted link was quite informative, as supplimental corroboration of other criticisms of Marcott. The Hockey Stick Resurrected By Marcott et al. 2012 suyts space

this fellow downloaded all the Marcott proxies himself and could find no modern uptick.

I output all nine proxies as CSV files and imported them into Excel to finally visualize the blade of the hockey stick. Starting at 1,500 before present (BP), I graphed the nine proxy datasets. And here’s what I got:
clip_image004.jpg


I encourage anyone who is interested in this stuff to read the link.

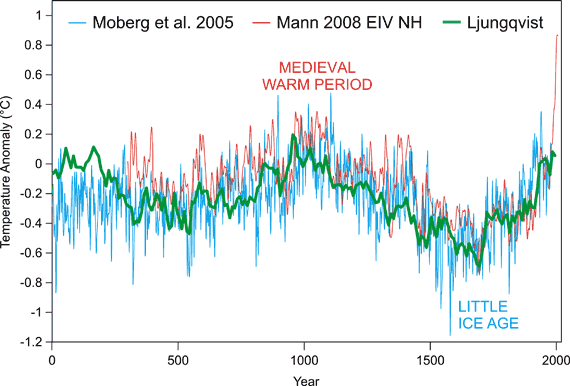
while doing some background checking I landed on this SkS page. How does Ljungqvist s reconstruction compare to others

MobergMannLjungkvist.gif


these are, of course, northern hemisphere reconstructions. but look how closely they match up. even Mann's graph agrees except for the very end, which would be considerably different without the contaminated Tiljander cores and instrumental splicing. warm MWP, cold LIA, return to 'precedented" warmth.
 
‘It would be nice to try to contain the putative “MWP”

:eusa_doh:

Doh! How was I supposed to know that our e-mails would be made public by wikileaks?
 
yup. the first Mann hockeystick removed the MWP and LIA. when its methodologies and data were found to be incorrect, climate science circled the wagons and created new spaghetti graphs that purportedly supported Mann but let the MWP and LIA re-emerge somewhat. they called it 'consistent with'. as more studies, updated proxies, new methods, and corrections to past works are made then the MWP and LIA keep getting larger and larger, to the point where they almost appear as well formed as they were seen 40 or 50 years ago. every step back is 'consistent with' their last position though. in a decade or two climate science will have back pedaled to the skeptics position but will claim that that had always been what they were stating.
 
thus find ourselves in the situation that the entire theory of man-made global warming—with its repercussions in science, and its important consequences for politics and the global economy—is based on ice core studies that provided a false picture of the atmospheric CO2 levels. Meanwhile, more than 90,000 direct measurements of CO2 in the atmosphere, carried out in America, Asia, and Europe between 1812 and 1961, with excellent chemical methods (accuracy better than 3 percent), were arbitrarily rejected. These measurements had been published in 175 technical papers. For the past three decades, these well-known direct CO2 measurements, recently compiled and analyzed by Ernst-Georg Beck (Beck 2006a, Beck 2006b, Beck 2007), were completely ignored by climatologists—and not because they were wrong. Indeed, these measurements were made by top scientists, including two Nobel Prize winners, using the techniques that are standard textbook procedures in chemistry, biochemistry, botany, hygiene, medicine, nutrition, and ecology. The only reason for rejection was that these measurements did not fit the hypothesis of anthropogenic climatic warming. I regard this as perhaps the greatest scientific scandal of our time. From among this treasure of excellent data (ranging up to
550 ppmv of measured CO2 levels), the founders of the anthropogenic global warming hypothesis (Callendar 1949, Callendar 1958, and From and Keeling 1986) selected only a tiny fraction of the data and doctored it, to select out the low concentrations and reject the high values—all in order to set a falsely low pre-industrial average CO2 concentration of 280 ppmv as the basis for all further climatic speculations. This manipulation has been discussed several times since the 1950s (Fonselius et al. 1956, Jaworowski et al. 1992b, and Slocum 1955), and more recently and in-depth by Beck 2007. The results of Ernst-Georg Beck’s monumental study of a large body of direct atmospheric CO2 measurements from the 19th and 20th Century, smoothed as five-year averages, are presented in Figure 5. The measurements show that the most important political message of the IPCC in 2007 is wrong: It is not true that the CO2 atmospheric level during the pre-industrial era was about 25 percent lower than it is now, and it is not true that anthropogenic emissions of CO2 have caused what is actually our beneficially warm climate today. Direct atmospheric measurements indicate that between 1812 and 1961, the concentrations of CO2 fluctuated by about 150 ppmv, up to values much higher than those of today. Except for the year 1885, these direct measurements were always higher than the ice core data, which are devoid of any variations. During the 149 years from 1812 to 1961, there were three periods when the average CO2 concentration was much higher than it was in 2004, 379 ppmv (IPCC 2007): Around the year 1820, it was about 440 ppmv; around 1855,
But no link to the source?
I guess you ignored the link on the post directly above this one.................MAYBE!
I see. Really difficult to put the link into the post with the quote? Oh well, here is what the author says further into the paper.

http://nzclimatescience.net/images/PDFs/co2scandal.pdf

A similar projection, based on observations of the cyclic activity of the Sun, was announced from the Pulkovo Observatory, near St. Petersburg, Russia. The head of the Space Research Laboratory of the Observatory, Prof. Habibullo I. Abdussamatov, stated that instead of professed
global warming, the Earth will be facing a slow decrease in temperatures in 2012-2015.

Hmmmmmmmm........................... 2014 warmest year on record, 2015 already looking like it will exceed 2014. That fellow is just full of shit.
 
How does Ljungqvist s reconstruction compare to others

Climate Myth...

Ljungqvist broke the hockey stick

"[Ljungqvist 2010 shows that] there is nothing unusual, nothing unnatural or nothingunprecedented about the planet's current level of warmth, seeing it was just as warm as, or even warmer than, it has been recently during both the Roman and Medieval Warm Periods, when the atmosphere's CO2 concentration was more than 100 ppm less than it is today. And this latter observation, together with the realization that earth's climatenaturally transits back and forth between cooler and warmer conditions on a millennial timescale, demonstrates that there is absolutely no need to associate the planet's current level of warmth with its current higher atmospheric CO2 concentration, in clear contradiction of the worn-out IPCC and climate-alarmist claim that the only way to explain earth's current warmth is to associate it with the greenhouse effect of CO2" (NIPCC)


Fredrik Ljungqvist created a 2000-year temperature history of the extra-tropical portion of the Northern Hemisphere (30-90°N) based on 30 proxy records. Certain "skeptics" have argued that his reconstruction shows greater natural variability than previousreconstructions, and that it shows the peak of the Medieval Warm Period (MWP) hotter than today's surface air temperatures.

Ljungqvist Compared to other Reconstructions
However, Ljungqvist's reconstruction is not substantially different from the many other millennial northern hemisphere temperature reconstructions, as the author himself states in his paper:

“Our temperature reconstruction agrees well with the reconstructions by Moberg et al. (2005) and Mann et al. (2008) with regard to the amplitude of the variability as well as the timing of warm and cold periods, except for the period c. AD 300–800, despite significant differences in both data coverage and methodology.”

Indeed by plotting Ljungqvist's data along with Moberg et al. (2005), Mann et al. (2008), and the surface temperature record, we can confirm that the three reconstructions are very similar (Figure 1).

MobergMannLjungkvist.gif


Figure 1: Moberg et al. 2005 NH (blue), Mann et al. 2008 EIV NH (red), and Ljungqvist 2010 NH (green). Courtesy of Robert Way and John Cook.

MWP Peak vs. Current Temperature
Contrary to "skeptic" claims that his reconstruction shows the peak of the MWP as hotter than today's temperatures, Ljungqvist says the following when combining his proxyreconstruction with recent instrumental temperature data:

“Since AD 1990, though, average temperatures in the extra-tropical Northern Hemisphere exceed those of any other warm decades the last two millennia, even the peak of the Medieval Warm Period”


Hmmm........................
 

Forum List

Back
Top