Here, I will walk you through this.
I have compiles tables for the states 2010 political party demographics, population, federal taxes paid, federal grant monies received, total food and nutrition monies received, and population density. This lets me calculation a number of derived values like per capita and per federal tax dollars.
I put in considerable effort to get straight to some numbers, so I am in the process of reorganizing. As an example, I have this nice graph;
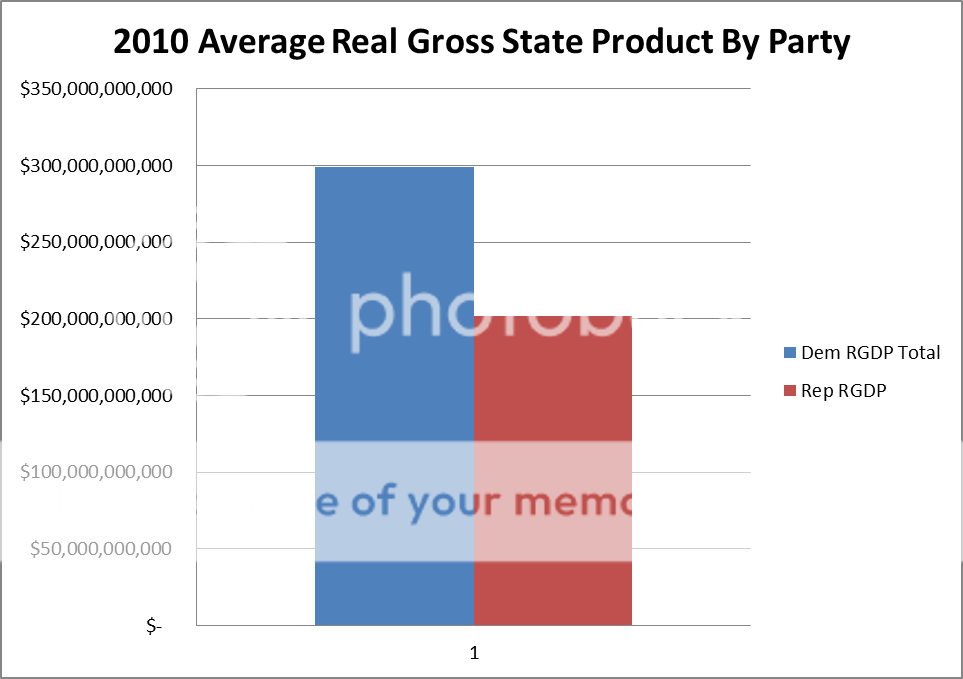
The values are calculated by identifying each red and blue state. For each, the total RGSP for all the blue and red states are added to get a total RGSP for all the blue states and all the red states. I then counted all the red and blue states. I then divided the Total_RGSP by total number of states to get an average RGSP per state.
This is a source for the 2010 political party affiliation by state.
Political party strength in U.S. states - Wikipedia, the free encyclopedia
It reads, "The partisan breakdown "demographics" provided in the following table are obtained from that state's party registration figures (from late 2010 whenever possible) where indicated."
It then provides a table of the voting demographics.
Here is a source for real dollar gross domestic product by state (or RGSP) for 2010
http://www.bea.gov/newsreleases/regional/gdp_state/2013/pdf/gsp0613.pdf
The result is the following table
State.........................RGSP.........................Dem RGDP.........................Rep RGDP.........................DemRep 2010
Vermont....................23,341.........................$23,341,000,000 ......................... $- .........................1
North Dakota..............31,618.........................$0 ......................... $31,618,000,000 .........................0
Montana....................31,918.........................$0 ......................... $31,918,000,000 .........................0
Wyoming...................32,004.........................$0 ......................... $32,004,000,000 .........................0
South Dakota.............34,371.........................$0 ......................... $34,371,000,000 .........................0
Rhode Island..............43,153.........................$43,153,000,000 ......................... $- .........................1
Alaska........................43,472.........................$0 ......................... $43,472,000,000 .........................0
Maine.........................45,564.........................$45,564,000,000 ......................... $- .........................1
Idaho.........................50,734.........................$0 ......................... $50,734,000,000 .........................0
West Virginia..............53,575.........................$53,575,000,000 ......................... $- .........................1
New Hampshire...........55,242.........................$55,242,000,000 ......................... $- .........................1
Delaware....................55,496.........................$55,496,000,000 ......................... $- .........................1
Hawaii........................59,673.........................$59,673,000,000 ......................... $- .........................1
New Mexico.................70,785.........................$70,785,000,000 ......................... $- .........................1
Nebraska....................80,638.........................$0 ......................... $80,638,000,000 .........................0
Mississippi...................85,363.........................$0 ......................... $85,363,000,000 .........................0
Arkansas....................92,075.........................$92,075,000,000 ......................... $- .........................1
Utah.........................105,199.........................$0 ......................... $105,199,000,000 .........................0
Nevada.....................109,610.........................$109,610,000,000 ......................... $- .........................1
Kansas.....................113,324.........................$0 ......................... $113,324,000,000 .........................0
Iowa........................124,011.........................$0 ......................... $124,011,000,000 .........................0
Oklahoma..................132,917.........................$132,917,000,000 ......................... $- .........................1
Kentucky...................141,977.........................$141,977,000,000 ......................... $- .........................1
South Carolina...........143,407.........................$0 ......................... $143,407,000,000 .........................0
Alabama....................153,839.........................$0 ......................... $153,839,000,000 .........................0
Oregon.....................174,165.........................$174,165,000,000 ......................... $- .........................1
Connecticut...............197,613.........................$197,613,000,000 ......................... $- .........................1
Louisiana...................200,944.........................$200,944,000,000 ......................... $- .........................1
Missouri....................216,681.........................$0 ......................... $216,681,000,000 .........................0
Wisconsin.................219,080.........................$219,080,000,000 ......................... $- .........................1
Arizona......................221,016.........................$0 ......................... $221,016,000,000 .........................0
Tennessee.................227,360.........................$0 ......................... $227,360,000,000 .........................0
Colorado...................230,976.........................$0 ......................... $230,976,000,000 .........................0
Minnesota.................240,418.........................$240,418,000,000 ......................... $- .........................1
Indiana.....................241,927.........................$0 ......................... $241,927,000,000 .........................0
Maryland..................264,321.........................$264,321,000,000 ......................... $- .........................1
Washington...............307,685.........................$307,685,000,000 ......................... $- .........................1
Michigan..................329,812.........................$329,812,000,000 ......................... $- .........................1
Massachusetts.........340,159.........................$340,159,000,000 ......................... $- .........................1
Georgia.................358,843.........................$0 ......................... $358,843,000,000 .........................0
Virginia...................377,466.........................$0 ......................... $377,466,000,000 .........................0
North Carolina.........380,693.........................$380,693,000,000 ......................... $- .........................1
Ohio........................413,991.........................$0 ......................... $413,991,000,000 .........................0
New Jersey..........431,409.........................$431,409,000,000 ......................... $- .........................1
Pennsylvania..........493,530.........................$493,530,000,000 ......................... $- .........................1
Illinois..................571,228.........................$571,228,000,000 ......................... $- .........................1
Florida.................650,291.........................$650,291,000,000 ......................... $- .........................1
New York.............1,013,251.........................$1,013,251,000,000 ......................... $- .........................1
Texas..................1,116,268.........................$0 ......................... $1,116,268,000,000 .........................0
California............1,672,473.........................$1,672,473,000,000 ......................... $- .........................1
You will notice that, in terms of total real GDP, both California and Texas are the largest, with California being $1.8 to Texas $1.1.
Never the less, you will also notice that the top ten largest economies include 7 democrat states while the smallest ten economies include 6 republican states.
When the amounts of RGSPs are added up then divided by the number of states, the results are that the blue states crank out more stuff as measured by RGSP.
You are welcome to add up all that yourself.


