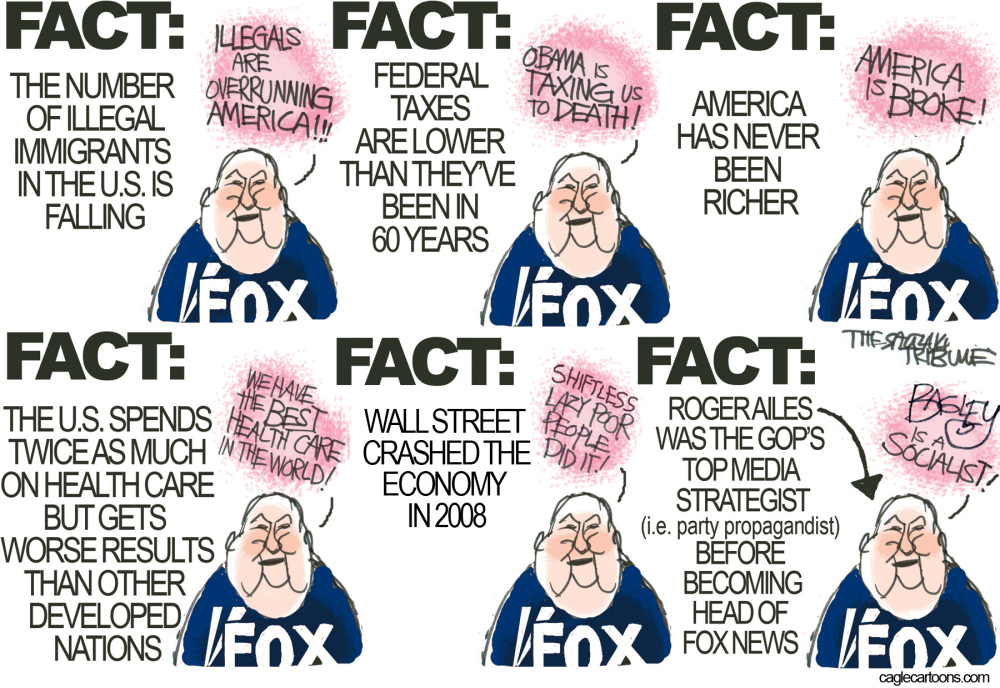
CONservatives "math" huh
BJ Bill's last F/Y budget ends
09/30/2001 $ 5,807,463,412,200.06
Dubya's last F/Y ends
09/30/
2009, $11,909,829,003,511.75. in debt
Government - Historical Debt Outstanding - Annual 2000 - 2014
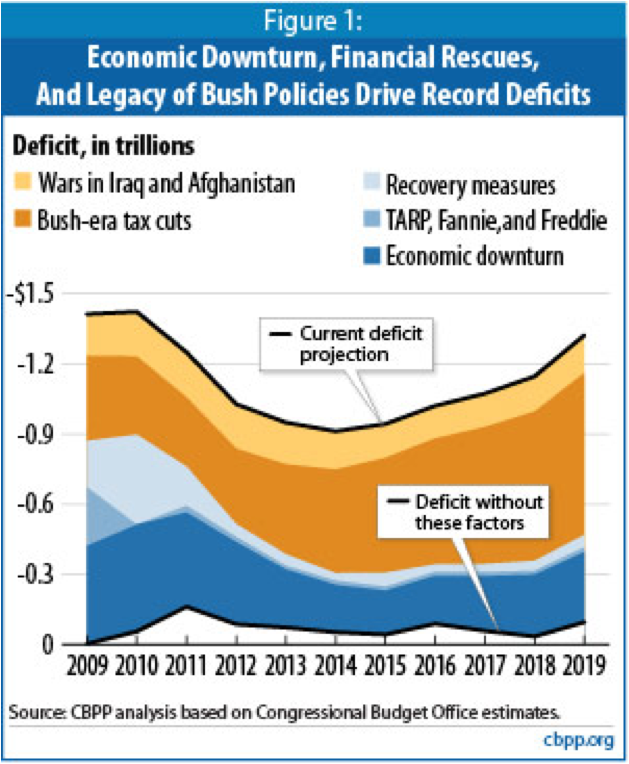
Economic Downturn and Legacy of Bush Policies Continue to Drive Large Deficits
Federal deficits and debt have been sharply higher under President Obama,
but the evidence continues to show that the Great Recession, President Bush’s tax cuts, and the wars in Afghanistan and Iraq explain most of the deficits that have occurred on Obama’s watch — based on the latest Congressional Budget Office projections as well as legislation enacted since we last issued this analysis of what lies behind current deficits and debt.
Economic Downturn and Legacy of Bush Policies Continue to Drive Large Deficits | Center on Budget and Policy Priorities
Yeah but mine was from Fact check .org
Dueling Debt Deceptions
AND??
Your shit is like, made up crap by random people we have no idea of whom they are... Mine is at least mostly repeatable.
Oh wait, you're about quantity over quality, spam stupid pictures of dude you wana **** with captions that only make sense to economically and politically ignorant hacks.
"Mine is at least mostly repeatable. "
LMAOROG
Sure Bubba, MINE is mostly "made up"
DEC 2007
The Economic Consequences of Mr. Bush
The next president will have to deal with yet another crippling legacy of George W. Bush: the economy. A Nobel laureate, Joseph E. Stiglitz,
sees a generation-long struggle to recoup.
The Economic Consequences of Mr. Bush
January 12, 2009
Bush Lead During Weakest Economy in Decades
President Bush has presided over the weakest eight-year span for the U.S. economy in decades, according to an analysis of key data, and economists across the ideological spectrum increasingly view his two terms as a time of little progress on the nation's thorniest fiscal challenges.
.
."For a group that claims it wants to be judged by history, there is no evidence on the economic policy front that that was the view," Holtz-Eakin ( a onetime Bush White House staffer and one of Sen. John McCain's top economic advisers) said.
"It was all Band-Aids."
Bush Lead During Weakest Economy in Decades
An extremely large tax cut that failed to pay for itself, two wars on the nation's credit card, an unfunded expansion of an entitlement program, and general overspending turned what could've been a cushy surplus into a huge deficit.
How Clinton Surplus Became A $6T Deficit - Business Insider
When President Bush took office in 2001, he inherited a $236 billion budget surplus, with a projected 10-year surplus of $5.6 trillion. When he ended his term, he left a $1.3 trillion deficit and a projected 10-year shortfall of $8 trillion.
Axelrod claims Bush saddled Obama with a big deficit
The Economic Blue Screen of Death
October 17, 2008
...Let's look at a graph I used two years ago, from work done by James Kennedy and Alan Greenspan, on the effect of
mortgage equity withdrawals (MEWs) on the growth of the US economy.
Notice that in both 2001 and 2002, the US economy continued to grow on an annual basis (the "technical" recession was just a few quarters).
Their work suggests that this growth was entirely due to MEWs. In fact, MEWs contributed over 3% to GDP growth in 2004 and 2005, and 2% in 2006. Without US homeowners using their homes as an ATM, the economy would have been very sluggish indeed, averaging much less than 1% for the six years of the Bush presidency. Indeed, as a side observation, without home equity withdrawals the economy would have been so bad it would have been almost impossible for Bush to have won a second term.
Now let's look at the update that James Kennedy posted last week to his numbers. While he does not have an update to the chart above, we do have the actual numbers for new mortgage equity withdrawals through the second quarter of this year. And what they show is MEWs simply withering on the vine. The engine of our GDP growth has essentially been turned off. Look at the fall in the numbers for yourself:
In 2005 there was almost $595 billion in mortgage extractions that went into some kind of consumer spending. Remember, according to the graph above, that translated into a 3% rise in GDP. In 2007, MEWs were down to $470 billion, for a boost of 2% to GDP.
The second quarter of 2008 saw an anemic $9.5 billion. At that run rate, we could see a drop-off of over 90% from 2005! Now, think what the second quarter would have been without the federal stimulus program of $150 billion. It might have looked and felt like this quarter!
The Economic Blue Screen of Death