Last time for you.. Wouldn't be putting this up again for just any ole denier.. Take notes. I'm not going down this rathole again...
https://html1-f.scribdassets.com/55430jptfk27j6ng/images/11-dea67dc7e8.jpg
A new stomatal proxy-based record of CO2 concentrations ([CO2]), based onBetula nana(dwarf birch)leaves from the Hässeldala Port sedimentary sequence in south-eastern Sweden, is presented. The recordis of high chronological resolution and spans most of Greenland Interstadial 1 (GI-1a to 1c, Allerød pollenzone), Greenland Stadial 1 (GS-1, Younger Dryas pollen zone) and the very beginning of the Holocene(Preboreal pollen zone).
The record clearly demonstrates that i) [CO2] were significantly higher thanusually reported for the Last Termination and ii) the overall pattern of CO
2 evolution through the studiedtime period is fairly dynamic, with significant abrupt fluctuations in [CO2] when the climate moved frominterstadial to stadial state and vice versa
A new loss-on-ignition chemical record (used here as a proxyfor temperature) lends independent support to the Hässeldala Port [CO2] record. The large-amplitude fluctuations around the climate change transitions may indicate unstable climates and that “tipping-point” situations were involved in Last Termination climate evolution. The scenario presented here is in contrast to [CO2]records reconstructed from air bubbles trapped in ice, which indicate lower concen-trations and a gradual, linear increase of [CO2] through time. The prevalent explanation for the mainclimate forcer during the Last Termination being ocean circulation patterns needs to re-examined, and a larger role for atmospheric [CO2] considered
And there's plenty more of this...
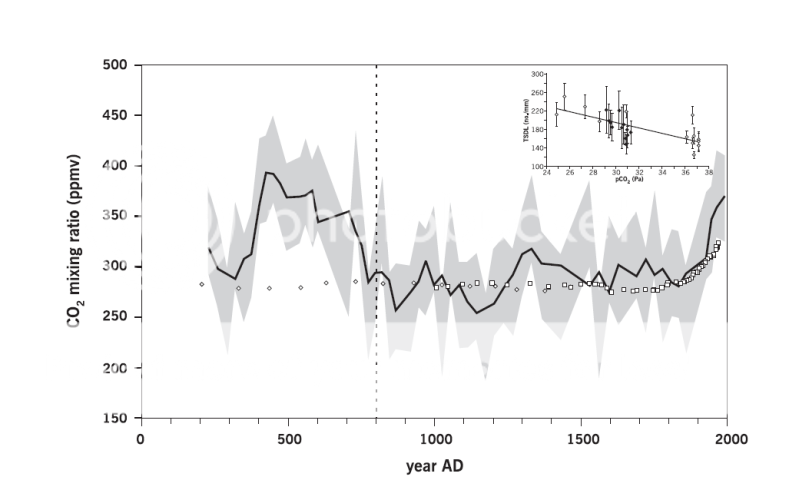
Fig. 14) Kouwenberg (2004) Figure 5.4: Reconstruction of paleo-atmospheric CO2 levels when stomatal frequency of fossil needles is converted to CO2 mixing ratios using the relation between CO2 and TSDL as quantified in the training set. Black line represents a 3 point running average based on 3–5 needles per depth. Grey area indicates the RMSE in the calibration. White diamonds are data measured in the Taylor Dome ice core (Indermühle et al., 1999); white squares CO2 measurements from the Law Dome ice-core (Etheridge et al., 1996). Inset: Training set of TSDL response of Tsuga heterophylla needles from the Pacific Northwest region to CO2 changes over the past century
NOTE -- in both of those (as in all of the HI RES studies of CO2 -- the ice core data is nothing more than a general mean value -- showing little or any response to changes under a 1000 years in duration..