
itfitzme
VIP Member
A fundamental effect on the US economy has been the rise in China manufacturing exports. A considerable number of specific explanations regarding the US economy are misplaced, attributing things like unemployment, energy costs, and every manner of economic measure to incorrect causes. Rather, unemployment, employment participation, energy costs including pump prices, US federal outlays, US federal budget deficit, public debt, consumer credit expansion, income levels, even the global housing bubble, have some foot in the rise of manufacturing exports from China.
Some are easily demonstrated, others are secondary, the response to the shifting structure of the US economy which is significantly affected by the global markets. Regardless, a significant number of economic changes are clearly traced back to the 1998-2000 time frames.
Some of the economic effects are detailed here, specifically
The Growth of Chinese Exports: An Examination of the Detailed Trade Data (Nov 2011)
FRB: The Growth of Chinese Exports: An Examination of the Detailed Trade Data
Some issues for consideration include "comparative advantage", "absolute advantage", global market competitiveness, and U.S. business investment in manufacturing in order to fully appreciate the breadth of China's manufacturing boom.
Still, the significant point is that of the timing of China exports which demonstrably began around 2000.

It was this ramping up of China manufacturing that set the stage for numerous effects on the US economy.
--------------------------------------------------
Fuel Costs Due To Increasing China Demand.
With regard to the increase in the cost of fuels on the global market place, what exactly occurred as a result of China manufacturing adding to the demand for fuel in the global market place is a significant question.
Seen here, at the very least, it is clear that the real dollar price of gasoline began its steady rise around 2000. Seen here, the real price was flat from 1988 through 2000, when it began to rise. (The sudden collapse of demand due to the recession of 09 can be seen along with the recovery of the economy which is marked by rising demand and increasing prices.)

We may ask ourselves what the complete set of factors underlie the price changes. Still, it is apparent that this began in 1999 to 2000.
--------------------------------
US Employment Employment to Population Ratio.
A highly significant change began in 2000 as the US labor market began changing. In 2000, the employment to population ratio began its downward trend.
Seen here, the long upward trend that began in the 60s reversed.

-------------------------------------
US Federal Budget Deficit
Seen here, the US federal budget deficit demonstrates a distinct change in 2000.

It is notable that there is a preceding trend that began in around 1970 that deserves some explanation. (I dont have one.) Never the less, while the deficit trend of 1970 was reversed during the administrations of President George Bush and President Bill Clinton, it was in 2000 that the deficit began its spiral down to a peak in response to the recession of 09.
The US public debt and federal outlay trends are simply tied by accounting and need no detailing here.
The fact that the initial driver of the US deficit was driven by China's manufacturing boom is apparent in the data. It is a reaction to the declining US manufacturing base, declining employment to population ration, and efforts to maintain GDP.
--------------------------------
HOUSING BUBBLE
Seen in the graphic below, the most recent housing bubble began no later than 2002, following shortly on the heels of Chinas increase in manufacturing export boom.
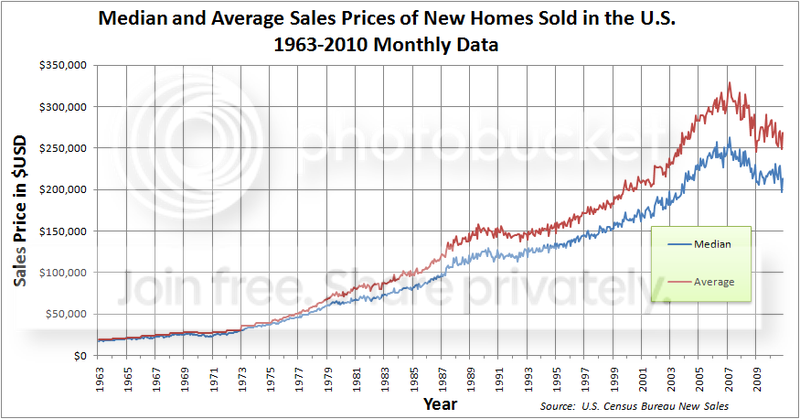
The causal link between the change in the global market and the housing bubble is indirectly. The loss of declining US manufacturing necessitated alternative mechanisms to facilitate economic growth. One was in the housing market, driven by a housing bubble.
There are additional effects such as the rise in mortgage backed securities and credit default swaps.
-------------------------------------
Mortgage Backed Securities
As well, the onset of mortgage backed securities was delayed, showing its larger growth beginning in the 2003-2004 time frame. It was driven by multiple mechanisms, not the least was the housing bubble which presented the opportunity for MBS supply. While the causal factors are links down the chain, the stage was initially set by the boom in China manufacturing and the reaction of the markets to the loss of a US manufacturing base with no alternative replacement.

---------------------------------------
Conclusion:
There are a few more economic effects that deserve attention, such as unemployment, consumer credit expansion, income levels, which have some foot in the rise of manufacturing exports from China.
Unfortunately, Ive run out of time. I did, though, feel a bit of an presentation of supply and demand is in order. All of these markets are linked in the macro economy. The consideration of how to interpret the increase in pump prices as a result of Chinas ever increasing demand deserves a careful consideration of how the equilibrium point for supply and demand comes about.
-----------------------------------------------
----------------------------------------------
Supply and demand changes and shifts.
The price and quantity of goods in the free market are the result of a balance that is struck between the supply and demand for the goods. The observed price and quantity is an equilibrium point and the relationship between price and quantity is restricted to a single direction. There is no definitive rule that says, When quantity increases then prices increase or When prices decrease then prices decrease. These incorrect statements are applied inappropriately as explanations for price trends, based not on sound understanding of the market but rather to reach the authors predisposed explanation. In fact, depending on many other factors, prices and quantities may move in tandem or opposition, producing no fewer than four different effects, more if we get really detailed.
Anyone interested in economics must be clear on the entire process of supply and demand. The four basic affects are permutations of these, each of which may increase of decrease; A change in the quantity demanded; A shift in the supply; A change in the quantity supplied; and a shift in demand.
The two sets of changes, quantity demanded with supply shift and demand shift with quantity supplied, each may have two directions of causality. This produces four distinct possible outcomes. These four possible outcomes may proceed in opposite directions, quantity being increased or decrease. This expands the number of specific outcomes to no less than eight. We may also consider there is no change in quantity whiles the other shifts as distinctive, expanding the entire set further.
The distinct connections between quantity changes and curve shifts.
When the quantity demanded increases, price goes down. In order for this to occur, the supply must shift to lower prices for higher quantities. When the quantity demanded decreases, the effect on supply is the opposite. There are specific economic processes on both the supply side and demand side that must occur.
When demand shifts in the direction of increasing quantity for lower prices, then the quantity supplied follows along. The pair, changes in quantity and price, are reversible as well. There are specific economic processes on both supply and demand that also must occur.
A definitive process that must occur is for a shift in demand. A shift in demand can only be the result of a change in income, or at least monies available for the specific good.
In general, the supply and demand in a market is seldom so neatly delineated. Rather, both supply and demand quantities as well as supply and demand shifts occur simultaneously as the markets interact and find a new equilibrium. Additionally, sudden shocks to supply and demand may have a specific short run effect followed by the complete opposite long run consequence.
For instance, demand shocks initially shift demand in the short run, followed by a long run shift in supply.

To further complicate matters, demand shocks may occur constantly, shifting the demand curve, as shown, while supply shifts follow behind.

The price and quantities observed in the market place seldom trace out one curve or the other but are the equilibrium prices as underlying conditions change. The significant point is that an observation of increases in pump prices is not necessarily and simply explained and the underlying forces must be carefully considered.
A detailed presentation of supply and demand may be found in this power point;
www.worthpublishers.com/Catalog/WorkArea/DownloadAsset.aspx?id=3992&libID=4014
------------------------------------------------------------------
References
Board of Governors of the Federal Reserve System International Finance Discussion Papers Number 1033 November 2011 The Growth of Chinese Exports: An Examination of the Detailed Trade Data Brett Berger Robert F. Martin
FRB: The Growth of Chinese Exports: An Examination of the Detailed Trade Data
www.federalreserve.gov/pubs/ifdp/2011/1033/ifdp1033.pdf
Gasoline prices rise due to increased crude oil costs - Today in Energy - U.S. Energy Information Administration (EIA)
Graph: Civilian Employment-Population Ratio (EMRATIO) - FRED - St. Louis Fed
Federal Surplus or Deficit [-] (FYFSD) - FRED - St. Louis Fed
Some are easily demonstrated, others are secondary, the response to the shifting structure of the US economy which is significantly affected by the global markets. Regardless, a significant number of economic changes are clearly traced back to the 1998-2000 time frames.
Some of the economic effects are detailed here, specifically
The Growth of Chinese Exports: An Examination of the Detailed Trade Data (Nov 2011)
Abstract: Over the past decade, Chinese exports have boomed, increasing far faster than GDP growth. What can account for this explosion? Our paper uses finely detailed Chinese export data (8-digit HS codes) combined with U.S. trade data to explore this question. Although exchange rate policy clearly boosted the trade surplus, and the structure of the economy, e.g. abundant cheap labor, encouraged investment, these alone cannot account for the changing composition and acceleration of exports. We find that the growth in exports is most likely a product of effective Chinese industrial policy and fortuitous timing. The detailed trade data reveal that key new technology goods, such as cell phones, LCD screens, and laptops played a critical role.
Finally, we use the data to examine the relationship between Chinese exports and global manufacturing, in particular U.S. manufacturing employment. We find that increased Chinese competition in both domestic and U.S. export markets likely lowered U.S. manufacturing employment between 2000 and 2007. Chinese policy is not, however, wholly responsible. Some job losses, such as in textile production, were no doubt the result of Chinas natural comparative advantages, while other U.S. job losses are attributable to relatively low investment and slow GDP growth in the United States following the 2001 recession.
FRB: The Growth of Chinese Exports: An Examination of the Detailed Trade Data
Some issues for consideration include "comparative advantage", "absolute advantage", global market competitiveness, and U.S. business investment in manufacturing in order to fully appreciate the breadth of China's manufacturing boom.
Still, the significant point is that of the timing of China exports which demonstrably began around 2000.

It was this ramping up of China manufacturing that set the stage for numerous effects on the US economy.
--------------------------------------------------
Fuel Costs Due To Increasing China Demand.
With regard to the increase in the cost of fuels on the global market place, what exactly occurred as a result of China manufacturing adding to the demand for fuel in the global market place is a significant question.
Seen here, at the very least, it is clear that the real dollar price of gasoline began its steady rise around 2000. Seen here, the real price was flat from 1988 through 2000, when it began to rise. (The sudden collapse of demand due to the recession of 09 can be seen along with the recovery of the economy which is marked by rising demand and increasing prices.)

We may ask ourselves what the complete set of factors underlie the price changes. Still, it is apparent that this began in 1999 to 2000.
--------------------------------
US Employment Employment to Population Ratio.
A highly significant change began in 2000 as the US labor market began changing. In 2000, the employment to population ratio began its downward trend.
Seen here, the long upward trend that began in the 60s reversed.

-------------------------------------
US Federal Budget Deficit
Seen here, the US federal budget deficit demonstrates a distinct change in 2000.

It is notable that there is a preceding trend that began in around 1970 that deserves some explanation. (I dont have one.) Never the less, while the deficit trend of 1970 was reversed during the administrations of President George Bush and President Bill Clinton, it was in 2000 that the deficit began its spiral down to a peak in response to the recession of 09.
The US public debt and federal outlay trends are simply tied by accounting and need no detailing here.
The fact that the initial driver of the US deficit was driven by China's manufacturing boom is apparent in the data. It is a reaction to the declining US manufacturing base, declining employment to population ration, and efforts to maintain GDP.
--------------------------------
HOUSING BUBBLE
Seen in the graphic below, the most recent housing bubble began no later than 2002, following shortly on the heels of Chinas increase in manufacturing export boom.

The causal link between the change in the global market and the housing bubble is indirectly. The loss of declining US manufacturing necessitated alternative mechanisms to facilitate economic growth. One was in the housing market, driven by a housing bubble.
There are additional effects such as the rise in mortgage backed securities and credit default swaps.
-------------------------------------
Mortgage Backed Securities
As well, the onset of mortgage backed securities was delayed, showing its larger growth beginning in the 2003-2004 time frame. It was driven by multiple mechanisms, not the least was the housing bubble which presented the opportunity for MBS supply. While the causal factors are links down the chain, the stage was initially set by the boom in China manufacturing and the reaction of the markets to the loss of a US manufacturing base with no alternative replacement.

---------------------------------------
Conclusion:
There are a few more economic effects that deserve attention, such as unemployment, consumer credit expansion, income levels, which have some foot in the rise of manufacturing exports from China.
Unfortunately, Ive run out of time. I did, though, feel a bit of an presentation of supply and demand is in order. All of these markets are linked in the macro economy. The consideration of how to interpret the increase in pump prices as a result of Chinas ever increasing demand deserves a careful consideration of how the equilibrium point for supply and demand comes about.
-----------------------------------------------
----------------------------------------------
Supply and demand changes and shifts.
The price and quantity of goods in the free market are the result of a balance that is struck between the supply and demand for the goods. The observed price and quantity is an equilibrium point and the relationship between price and quantity is restricted to a single direction. There is no definitive rule that says, When quantity increases then prices increase or When prices decrease then prices decrease. These incorrect statements are applied inappropriately as explanations for price trends, based not on sound understanding of the market but rather to reach the authors predisposed explanation. In fact, depending on many other factors, prices and quantities may move in tandem or opposition, producing no fewer than four different effects, more if we get really detailed.
Anyone interested in economics must be clear on the entire process of supply and demand. The four basic affects are permutations of these, each of which may increase of decrease; A change in the quantity demanded; A shift in the supply; A change in the quantity supplied; and a shift in demand.
The two sets of changes, quantity demanded with supply shift and demand shift with quantity supplied, each may have two directions of causality. This produces four distinct possible outcomes. These four possible outcomes may proceed in opposite directions, quantity being increased or decrease. This expands the number of specific outcomes to no less than eight. We may also consider there is no change in quantity whiles the other shifts as distinctive, expanding the entire set further.
The distinct connections between quantity changes and curve shifts.
When the quantity demanded increases, price goes down. In order for this to occur, the supply must shift to lower prices for higher quantities. When the quantity demanded decreases, the effect on supply is the opposite. There are specific economic processes on both the supply side and demand side that must occur.
When demand shifts in the direction of increasing quantity for lower prices, then the quantity supplied follows along. The pair, changes in quantity and price, are reversible as well. There are specific economic processes on both supply and demand that also must occur.
A definitive process that must occur is for a shift in demand. A shift in demand can only be the result of a change in income, or at least monies available for the specific good.
In general, the supply and demand in a market is seldom so neatly delineated. Rather, both supply and demand quantities as well as supply and demand shifts occur simultaneously as the markets interact and find a new equilibrium. Additionally, sudden shocks to supply and demand may have a specific short run effect followed by the complete opposite long run consequence.
For instance, demand shocks initially shift demand in the short run, followed by a long run shift in supply.

To further complicate matters, demand shocks may occur constantly, shifting the demand curve, as shown, while supply shifts follow behind.

The price and quantities observed in the market place seldom trace out one curve or the other but are the equilibrium prices as underlying conditions change. The significant point is that an observation of increases in pump prices is not necessarily and simply explained and the underlying forces must be carefully considered.
A detailed presentation of supply and demand may be found in this power point;
www.worthpublishers.com/Catalog/WorkArea/DownloadAsset.aspx?id=3992&libID=4014
------------------------------------------------------------------
References
Board of Governors of the Federal Reserve System International Finance Discussion Papers Number 1033 November 2011 The Growth of Chinese Exports: An Examination of the Detailed Trade Data Brett Berger Robert F. Martin
FRB: The Growth of Chinese Exports: An Examination of the Detailed Trade Data
www.federalreserve.gov/pubs/ifdp/2011/1033/ifdp1033.pdf
Gasoline prices rise due to increased crude oil costs - Today in Energy - U.S. Energy Information Administration (EIA)
Graph: Civilian Employment-Population Ratio (EMRATIO) - FRED - St. Louis Fed
Federal Surplus or Deficit [-] (FYFSD) - FRED - St. Louis Fed
