Toddsterpatriot
Diamond Member
Toddster is toddling around waving his little hands.")
So long Robin.
Follow along with the video below to see how to install our site as a web app on your home screen.
Note: This feature may not be available in some browsers.
Toddster is toddling around waving his little hands.
The 1% don’t work off a W-2 toddHelp your buddy out, he can't seem to find any evidence for his claim.
Or run away again. DURR
The 1% don’t work off a W-2 todd
Hilarious toddNo evidence the "working class" pay higher rates than the "wealthy"?
Hilarious todd
One pays taxes off a W-2 and the other uses capital gains or loans with tax shelters.And there you go, running away without posting any numbers.
Hilarious indeed.
Now show us how that is done. A couple of examples will do.One pays taxes off a W-2 and the other uses capital gains or loans with tax shelters.
todd
Hilarious….your source starts off with “But, according to Trump, businesses file for bankruptcy often, and it was a financially intelligent move. He added that “hundreds of companies” have done the same thing he did.”FACT you are a liar!
Despite never having filed for personal bankruptcy, reports

How Often Has Donald Trump Declared Bankruptcy? - Cibik Law, P.C.: Trusted Philadelphia Bankruptcy Lawyers
Donald Trump's business record seems riddled with unfortunate events. Despite never having filed for personal bankruptcy, reports state that he filed for business bankruptcy at least four times.philadelphiabankruptcylawyers.com
One pays taxes off a W-2 and the other uses capital gains or loans with tax shelters.
todd
"...in 2023, a single filer with taxable income of $100,000 will pay $17,400 in tax, or an average tax rate of 17%. But your marginal tax rate or tax bracket is actually 24%..."One pays taxes off a W-2 and the other uses capital gains or loans with tax shelters.
todd

The labor force participation rate went up from 62.5% in May 2024 to 62.6% for June 2024.
FACTS:From this source: Bureau of Labor Statistics DataThe monthly unemployment rate for June 2024 was 4.1%. This is the 42nd unemployment report with Biden in office, his 42nd month recorded for this list. This keeps Biden's average unemployment rate for his term in office to date, at 4.16% for June 2024, the same as it was for May 2024.
The President with the worst average unemployment rate since World War II is?
Gerald Ford: 7.77%
Average Unemployment Rates for US Presidents since after World War II:
01. Joe Biden: 4.16%
02. Lyndon Johnson: 4.19%
03. Harry Truman: 4.26%
04. Dwight Eisenhower: 4.89%
05. Richard Nixon: 5.00%
06. Donald Trump: 5.01%
07. Bill Clinton: 5.20%
08. George W. Bush: 5.27%
09. John Kennedy: 5.98%
10. George H.W. Bush: 6.30%
11. Jimmy Carter: 6.54%
12. Barack Obama: 7.45%
13. Ronald Reagan: 7.54%
14. Gerald Ford: 7.77%
The labor force participation rate went up from 62.5% in May 2024 to 62.6% for June 2024.
FACTS:From this source: Bureau of Labor Statistics Data
How many of the increase in labor force was from "RE-HIRES" who lost their jobs due to Covid?
Recovery versus “Creation.”
Nearly 72 percent of all job gains since 2021 were simply jobs that were being recovered from the pandemic, not new job creation. In fact, when looking at today’s economy compared to pre-pandemic levels, employment is up only by 3.7 million.
Fact Check: Biden Misleads on Job “Creation” Statistics | The U.S. House Committee on the Budget - House Budget Committee
The Official U.S. Congressional website of The Republican Budget Committeebudget.house.gov
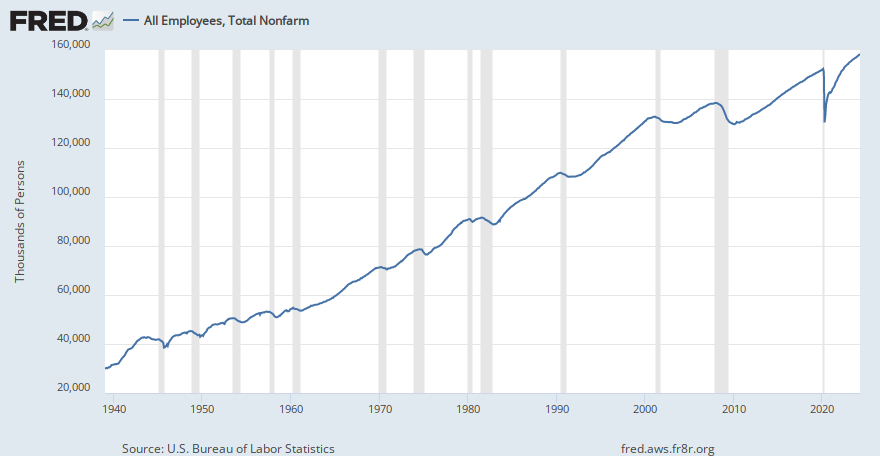
Guess what? A higher percentage of American workers are working today than ever before."All Employees, Total Nonfarm
View the number of nonfarm employees in the U.S., who account for approximately 80 percent of the workers who contribute to GDP.fred.stlouisfed.org
More lies and outdated information from the you...
We are 4,593,000 when compared to pre-pandemic numbers.

 www.wral.com
Guess what? A higher percentage of American workers are working today than ever before."
But Biden’s statement that "a higher percentage of American workers are working today than ever before" is murkier, because there is no single statistic that correlates to his exact phrasing.
"During Biden’s first 30 months in office, just 2.1 million new jobs were created, and by contrast, during my first 30 months in office we created 4.9 million new jobs," Trump said Aug. 5.Fact check: Biden says higher percentage of Americans working than ever
President Joe Biden recently visited Milwaukee to tout "Bidenomics" -- the economic policies he's instituted during his two and a half years in office, which he says have produced significant employment gains.
This means that roughly 11 million of the 13.2 million-job increase on Biden’s watch are simply "workers returning from pandemic layoffs" rather than jobs actually created, the campaign said in a statement.
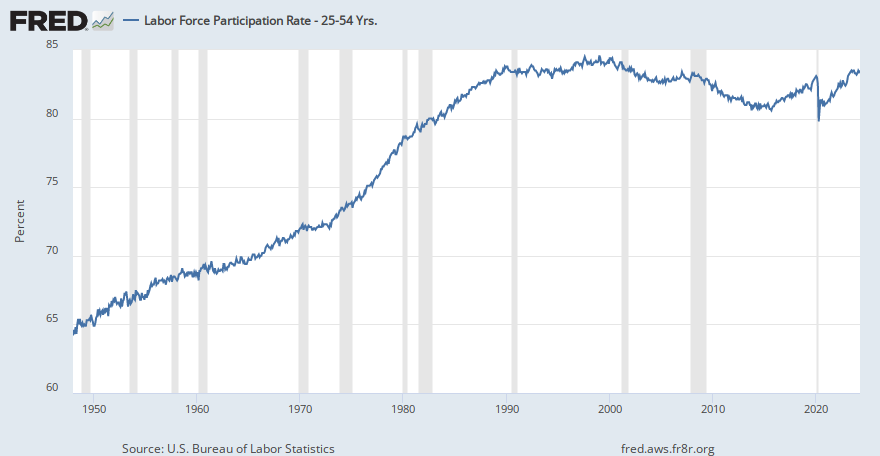
The Core Working age LFPR is at levels last seen in 2000.
Labor Force Participation Rate - 25-54 Yrs.
Graph and download economic data for Labor Force Participation Rate - 25-54 Yrs. (LNS11300060) from Jan 1948 to Apr 2026 about 25 to 54 years, participation, civilian, labor force, household survey, labor, rate, and USA.fred.stlouisfed.org
View attachment 972399
 tradingeconomics.com
NOTE Feb 2020 was the highest at 61.1% under Trump...since 2015.United States Employment Rate
Employment Rate in the United States decreased to 59.20 percent in March from 59.30 percent in February of 2026. This page provides - United States Employment Rate- actual values, historical data, forecast, chart, statistics, economic calendar and news.
The lowest since 2015 was 51.20 percent in April of 2020
Then all the jobs that were gone after 4/2020 of nearly 10% were all back under Biden...
BUT where has the number gone up with NEW jobs holders? It was under Trump but
under Biden it's "re-hiring" NOT CREATED new jobs.
And Biden as of 5/2024 60.1%.
So after a drop due to companies closing because of Covid letting people go,
View attachment 972415
Why are you using 25 to 54 years old?The Core Working age LFPR is at levels last seen in 2000.
This is vital as more people retire out of the workforce.
Labor Force Participation Rate - 25-54 Yrs.
Graph and download economic data for Labor Force Participation Rate - 25-54 Yrs. (LNS11300060) from Jan 1948 to Jun 2024 about 25 to 54 years, participation, civilian, labor force, labor, household survey, rate, and USA.
fred.stlouisfed.org


 www.bls.gov