Dumbfuck, you lied, that's why you can't post a graph beyond 2018.
I even posted a link to the
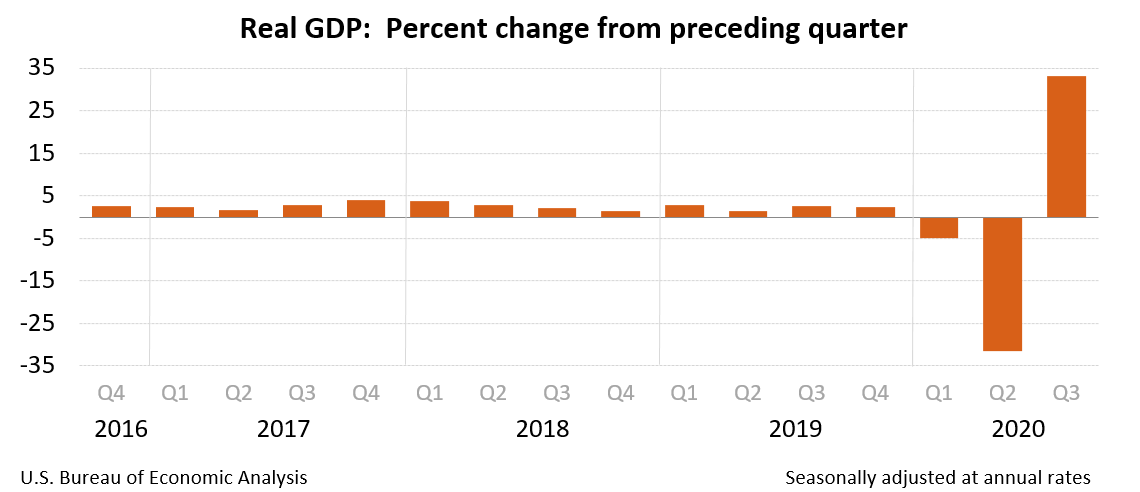
current data which shows Q2-2018 was 2.7%, not 4.2%.
What the hell does 2019 and 2020 have to do with 2nd quarter of 2018. Getting desperate to scrounge up debate material ?
And OH, you
"posted a link to the current data which shows Q2-2018 was 2.7%, not 4.2%."
HA HA HA. one little problem there Funny Farm Faun.
I already noted that the reason the
"current data" as you call it, is what it is , is because the lying, cheating, full of shit BEA, loaded with Obama holdovers, cooked the books to make it appear that way.
So you're a little LATE with your "current data" line. Ah, but libbies will challenge that by saying WHAT EVIDENCE do you have!!!!!!!!!!!!!!!!!!
Well, the evidence, my information-deprived victim of liberal OMISSION/ DISTORTION media and govt agencies, friend, is that the BEA has made lots of changes in their numbers, continuously over time. And guess what consistency shows up in all these changes. > They all change making Obama look better, and Trump look worse - statistical anomaly. Ho hum. Yawn****
Now go wash out your mouth with soap, and then come back and report to me.