You are babbling, fool.
The material well-being of the poor/working classes has improved 50% since 1980.
Is that a growth in their 'income' or not?
Or did someone not tell you that welfare is now the #1 expense item in the Federal budget?
You are the babbling fool. You go to the polls and vote for millionaires and corporations while you more than likely make less than $100K yourself. In other words.....vote for the bible thumpers and aganst your own interests. Just like the Joe the Plumber guy who cleaned out septic tanks but dreamed of getting his boss's job.
More weak minded class-warfare whining.
You lead with 'facts', and now won't bother to defend them.
The material well-being of the poor/working classes has improved 50% since 1980.
Is that a growth in their 'income' or not?
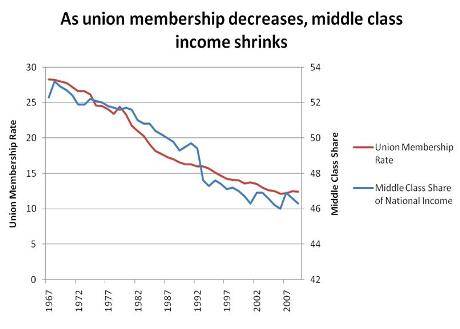
Well goddamit you just don't get it. 50% my ass...that was before the union busting, funneling of borrowed money to the top by Reagan and the Bushes. Manufacturing jobs are at an all time low. The mortgage industry has bottomed. We import twice as much as we export, Banks and Wall St. are playing games with the money. Over 500 companies make money off of sick people and we still rank 37th in the world for general health and longevity. It won't be long till what used to be the middle class of this country will work 80 hours a week and no benefits for about the same on a global scale as a day laborer in Maylasia.....which is exactly what the Republican party has been shooting for:
Total U S Debt
09/30/2009 $11,909,829,003,511.75
(80% Of All Debt Across 232 Years Borrowed By Reagan And Bushes)
09/30/2008 $10,024,724,896,912.49
(Times Square Debt Clock Modified To Accomodate Tens of Trillions)
09/30/2007 $9,007,653,372,262.48
09/30/2006 $8,506,973,899,215.23
09/30/2005 $7,932,709,661,723.50
09/30/2004 $7,379,052,696,330.32
09/30/2003 $6,783,231,062,743.62
(Second Bush Tax Cuts Enacted Using Reconciliation)
09/30/2002 $6,228,235,965,597.16
09/30/2001 $5,807,463,412,200.06
(First Bush Tax Cuts Enacted Using Reconciliation)
09/30/2000 $5,674,178,209,886.86
(Administration And Congress Arguing About How To Use Surplus)
09/30/1999 $5,656,270,901,615.43
(First Surplus Generated...On Track To Pay Off Debt By 2012)
09/30/1998 $5,526,193,008,897.62
09/30/1997 $5,413,146,011,397.34
09/30/1996 $5,224,810,939,135.73
09/29/1995 $4,973,982,900,709.39
09/30/1994 $4,692,749,910,013.32
09/30/1993 $4,411,488,883,139.38
(Debt Quadrupled By Reagan/Bush41)
09/30/1992 $4,064,620,655,521.66
09/30/1991 $3,665,303,351,697.03
09/28/1990 $3,233,313,451,777.25
09/29/1989 $2,857,430,960,187.32
09/30/1988 $2,602,337,712,041.16
09/30/1987 $2,350,276,890,953.00
09/30/1986 $2,125,302,616,658.42
09/30/1985 $1,823,103,000,000.00
09/30/1984 $1,572,266,000,000.00
09/30/1983 $1,377,210,000,000.00
09/30/1982 $1,142,034,000,000.00
(Total Debt Passes $1 Trillion)
09/30/1981 $997,855,000,000.00