abu afak
ALLAH SNACKBAR!
- Mar 3, 2006
- 7,984
- 2,771
- 315
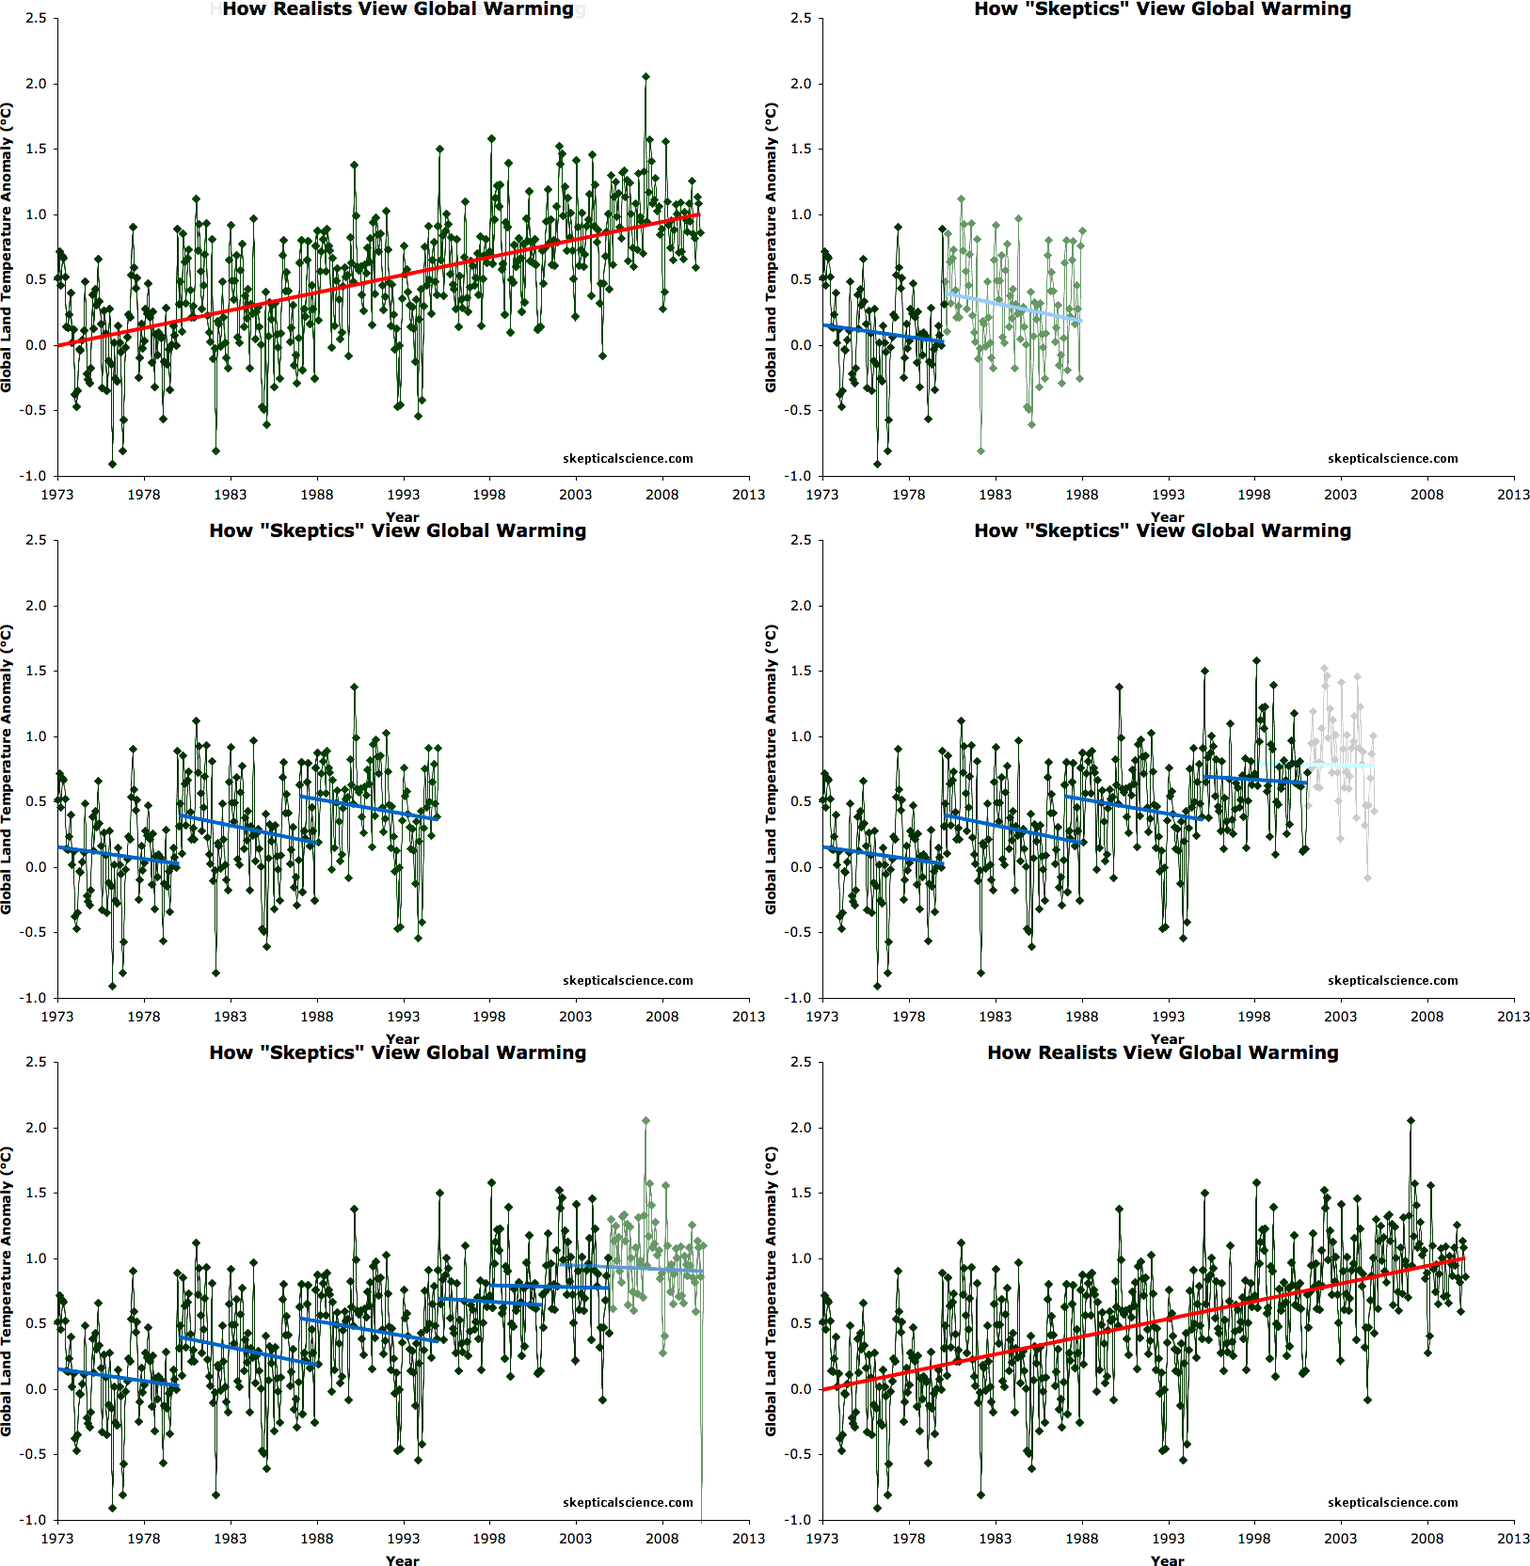
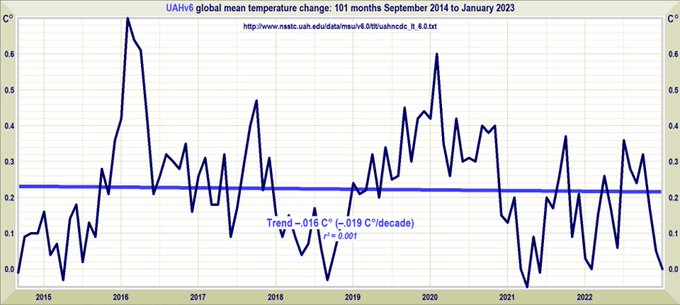
At every pause/blip, or after every Spike UP in a LONG TERM UPTREND they DISHONESTLY draw a 7/8 yr "Downtrend" starting at the spike year. Nothing natural goes straight up, and is subjct to short term things like La nina and sunspot cycle.
But it is unmistakably in a Long Term Uptrend.
Additionally Not recognizing 2020 was the second warmest year after 2016.. which was higher than anything on the graph below.
But nothing in nature Goes straight up.
Earlier version of this Dishonesty but it's WARMER in each one and warmer in the last. (2016 Record and 2020 close Second)
This myth stems from a lack of understanding of exactly what global warming is. The term refers to the long-term warming of the global climate, usually measured over a timescale of about 30 years, as defined by the World Meteorological Organization. This is because global warming is caused by a global energy imbalance - something causing the Earth to retain more heat, such as an increase in solar radiation reaching the surface, or an increased greenhouse effect.
There are also a number of effects which can have a large impact on short-term temperatures, such as oceanic cycles like the El Niño Southern Oscillation or the 11-year solar cycle. Sometimes these dampen global warming, and sometimes they amplify it. However, they're called "oscillations" and "cycles" for a reason - they alternate between positive and negative states and don't have long-term effects on the Earth's temperature.
Right now we're in the midst of a period where most short-term effects are acting in the cooling direction, dampening global warming. Many climate "skeptics" are trying to capitalize on this dampening, trying to argue that this time global warming has stopped, even though it didn't stop after the global warming "pauses" in 1973 to 1980, 1980 to 1988, 1988 to 1995, 1995 to 2001, or 1998 to 2005 (Figure 1).[/b]
Figure 1: BEST land-only surface temperature data (green) with linear trends applied to the timeframes 1973 to 1980, 1980 to 1988, 1988 to 1995, 1995 to 2001, 1998 to 2005, 2002 to 2010 (blue), and 1973 to 2010 (red). Hat-tip to Skeptical Science contributor Sphaerica for identifying all of these "cooling trends."

Yes, look at all that "Cooling!" and "No warming for 7/8 years!"
and since there have been yet more STEPS UP. (2016 Record with 2020 close second)

`
But it is unmistakably in a Long Term Uptrend.
Additionally Not recognizing 2020 was the second warmest year after 2016.. which was higher than anything on the graph below.
But nothing in nature Goes straight up.
Earlier version of this Dishonesty but it's WARMER in each one and warmer in the last. (2016 Record and 2020 close Second)
Global Surface Temperature: Going Down the Up Escalator, Part 1
Posted on 5 November 2011 by dana1981
One of the most common misunderstandings amongst climate "skeptics" is the difference between short-term noise and long-term signal. In fact, "it hasn't warmed since 1998" is ninth on the list of most-used climate myths, and "it's cooling" is fifth.This myth stems from a lack of understanding of exactly what global warming is. The term refers to the long-term warming of the global climate, usually measured over a timescale of about 30 years, as defined by the World Meteorological Organization. This is because global warming is caused by a global energy imbalance - something causing the Earth to retain more heat, such as an increase in solar radiation reaching the surface, or an increased greenhouse effect.
There are also a number of effects which can have a large impact on short-term temperatures, such as oceanic cycles like the El Niño Southern Oscillation or the 11-year solar cycle. Sometimes these dampen global warming, and sometimes they amplify it. However, they're called "oscillations" and "cycles" for a reason - they alternate between positive and negative states and don't have long-term effects on the Earth's temperature.
Right now we're in the midst of a period where most short-term effects are acting in the cooling direction, dampening global warming. Many climate "skeptics" are trying to capitalize on this dampening, trying to argue that this time global warming has stopped, even though it didn't stop after the global warming "pauses" in 1973 to 1980, 1980 to 1988, 1988 to 1995, 1995 to 2001, or 1998 to 2005 (Figure 1).[/b]
Figure 1: BEST land-only surface temperature data (green) with linear trends applied to the timeframes 1973 to 1980, 1980 to 1988, 1988 to 1995, 1995 to 2001, 1998 to 2005, 2002 to 2010 (blue), and 1973 to 2010 (red). Hat-tip to Skeptical Science contributor Sphaerica for identifying all of these "cooling trends."

Yes, look at all that "Cooling!" and "No warming for 7/8 years!"
and since there have been yet more STEPS UP. (2016 Record with 2020 close second)

Global Surface Temperature: Going Down the Up Escalator, Part 1
One of the most common misunderstandings amongst climate 'skeptics' is the difference between short-term noise and long-term signal. In fact, 'it hasn't warmed since 1998' is ninth on the list of most-used climate myths, and 'it's cooling' is fifth.
skepticalscience.com
`
Last edited:


