Thats the seasonal shift...
You compare oil to the previous year on the same month...
Is this the first time you looked at oil production figures..
Oh, it looks like YOU ASKED FOR IT >>>
The following report is pre-2024, before Biden began to ramp up for the ELECTION year >>
Biden's production was a
major reduction from what Trump's production was, and even much more major, when we extrapolate Trump's rising line to January 2023, if he had retained the presidency.
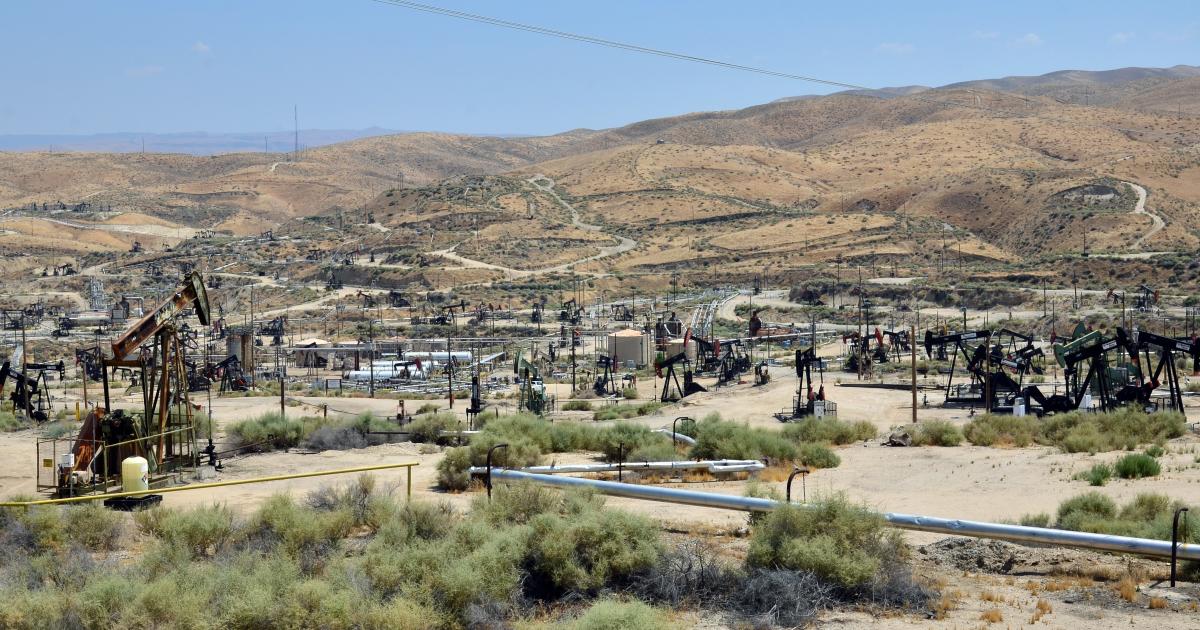
Oil production overall not only increased, during the Trump administration, it soared, and was vastly greater than the production we've gotten with Biden.
Trump production
December 2019 -
402.3 Million Barrels/month
January 2020 -
398.4
And Trump exceeded Biden's top month of
371.2 Million Barrels/month
NINE TIMES, despite the Obama low production influences and later, the pandemic months reductions. And note also that Biden's top production month of
371.2, was recently in August of 2022, when he started increasing production, to try to lower gas prices, as we started getting closer to the 2022 ELECTION.
Biden's 2021 average is
341 Million Barrels/month compared to Trump's
374.
Biden's 2022 average (when he ramped up production as the 2022 election drew closer) wasn't much better >
354.
| | | | | | | | | | | | |
| | | | | | | | | | | | 8 |
| 2017 | 275,117 | 255,081 | 284,146 | 273,041 | 284,727 | 273,321 | 286,657 | 286,759 | 285,499 | 299,726 | 302,564 | 309,486 |
| 2018 | 310,032 | 287,870 | 324,467 | 314,996 | 323,491 | 319,216 | 337,814 | 353,154 | 343,298 | 356,767 | 356,583 | 370,284 |
| 2019 | 367,924 | 326,845 | 369,292 | 364,458 | 376,763 | 366,546 | 368,965 | 387,073 | 377,710 | 397,094 | 390,010 | 402,314 |
| | | | | | | | | | | | |
| 2020 | 398,420 | 372,419 | 396,693 | 357,412 | 301,105 | 313,275 | 341,184 | 327,875 | 327,623 | 324,180 | 335,867 | 346,223 |
| 2021 | 344,846 | 277,891 | 351,102 | 339,142 | 352,036 | 340,693 | 351,757 | 349,600 | 327,526 | 358,626 | 353,702 | 360,666 |
| 2022 | 352,449 | 316,851 | 362,725 | 350,052 | 360,503 | 353,918 | 367,164 | 371,339 | 368,040 | | | |
U.S. Field Production of Crude Oil (Thousand Barrels)
AND, if we extrapolate the EIA graph curve of Trump to now (Dec. 2022) if Trump were still president, it would be whopping
580 Million Barrels/month - HUNDREDS of Barrels/month more than Biden ever allowed produced.
U.S. Field Production of Crude Oil (Thousand Barrels)
Look at the graph line where it peaked at
402 Million Barrels/mo in December of 2019. Because of the climb up to that point, there is every reason to believe, that had the pandemic shutdowns not occured,
that rising line would have continued rising exactly as it was already doing. And if Trump had remained president, and we thereby
extend-extrapolate the line to as far as December 2022, we can easily see that it would be at about
580 Million Barrels/mo
(209 million Barrels/mo more than Biden's measly 371 Million).
Go ahead - put a ruler on the line that starts at 2017 when Trump took over, and look at where it goes to for December 2022 > 580 Million
All one need do to see the stark difference between the oil-friendly Trump and the oil-hostile Biden, is look at the
NOSEDIVE oil production took between Trump's last month, and Biden's first month (when he issued an EO to halt oil drilling)
Trump's last month in office was January 2021 - production was
344 MB/mo. Bidens first month was
277.
A DROP of a whopping 67 MB/mo Sure, because that was right after Biden issued EOs cancelling oil leases
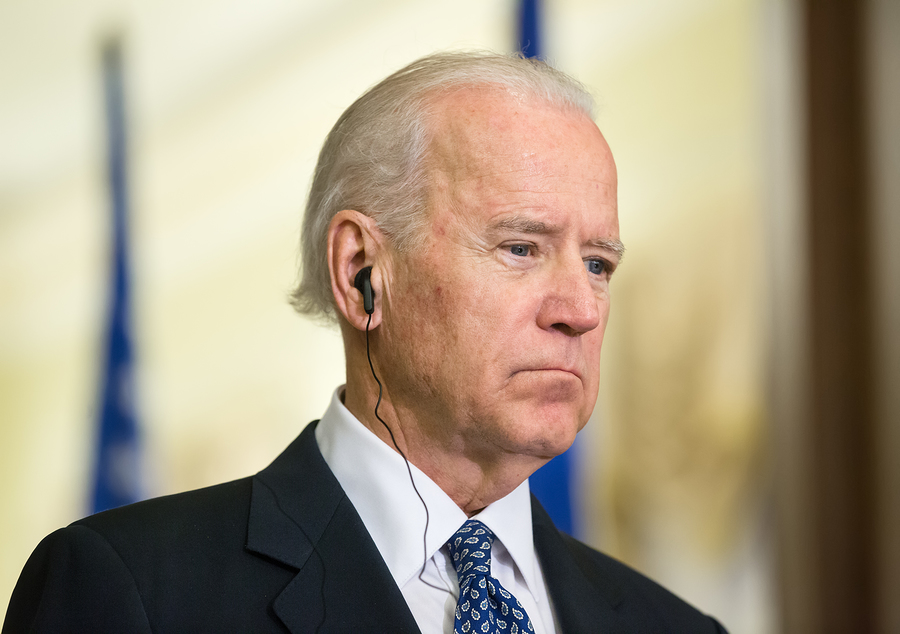
Biden signs executive order pausing federal drilling leases


 Would you as American or foreigner believe Mort he is Austrian
 Trump now has "media offenders". Has Trump ever heard of the First Amendment?

