There is no cyclical trend shown in POS FRAUD. if u removed the cyclical.. it would be a gentle minor down slope.. NOT A GIANT LIMP DICK.
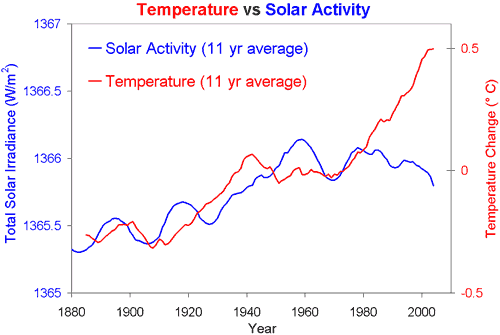
Dude, in the Skepticalscience.com graph, the x-axis ranges from 1880 to 2009. The PMOD ranges from 1978 to 2012. To expect such short term cycles to show up in a much longer-term graph is, how shall I put this nicely - stoooopid. Ever hear of scaling? At any rate, both show a downward trend in TSI. The skepticascience.com graph compares that downward trend to global temperatures, and when that it done, it is clear that there is a significant divergence from 1980 to the present. Which corroborates the more recent work I posted at this link:
http://www.sciencedaily.com/releases...1107204235.htm
A link which you are still conveniently ignoring.
First of all that link is dead, but it`s not a problem to find the crap on yet another one of your crap "science" mouth pieces where they discuss galactic rays, not solar irradiance.
Solar activity playing a minimal role in global warming, research suggests
It starts out with great fanfare (as usual)
Solar Activity Playing a Minimal Role in Global Warming, Research Suggests
But in reality never addresses solar irradiance on climate. It only examines some nuthead idea how galactic rays may or may not influence cloud formation. Both hypothesis have been "proven" yet again with a "computer model".
So why did you even bring that one up?
What`s that got to do with the effect of solar irradiance?
Are you that stupid or simply cant` understand the difference and all you were looking for with Google was any article other than "skepticalscience" that had the words "solar activity" + "minimum role" -"skepticalscince.com"
...and pounced on the first thing that came up.
Then you were too eager to boast the link, without even reading the article...and even screwed up that part as well.
None of that surprises me after you pointed to a single solar irradiance low at 2008 of where they switched to a VIRGO
maximum low of about 1365.75 [watts /m^2] and try pass that off as some sort of "scientific proof" to de-couple solar irradiance from temperature.
Let me get this straight.
Idiots like you advocate that
1.) CO2 "leads temperature"
2.) That it may take years of delay before the CO2 "feedback" manifests itself as a new temperature equilibrium
3.) That not even 15 years of stalled temperature increase is a "trend"
4.) All of you 3 idots in this forum accept no less than a 150 year time period
But when it comes to solar irradiation one data point + or - 1 year is enough for you to "rule out" any "trend" other than CO2.
In the process
you never even noticed how the IPCC has been pulling the wool over your head.
They keep plugging a "solar constant" into their CO2 myth models which is
lower than the average as an "average" of what it shows on the stuff you keep posting.
No matter how often I point that out you keep missing the entire boat.
So I guess it`s no use to try and educate you with some basics about heat conduction, equilibrium state etc unless they are simple enough for dummies like you. Maybe this will help you to come to grips with what happens when you apply heat to an object.
[ame="http://www.youtube.com/watch?v=U4tt5wQr-Po"]Thermal Conductivity - YouTube[/ame]
See the time delay?...and these are different metal rods, small mass and being heated with a blowtorch.
What makes you think that an entire "average global temperature" should instantly respond, lock-step in time to what the sun is doing at any given time ?...and according to you "failed to do so".
Really? How would you know ?
In the same thread
you and the other resident idiots
kept claiming that heat is there alive and well...down in the depths of our oceans and posted a whole bunch of graphs where the "missing heat" can be found.
Keep posting...so far you, "PMZ" etc have been doing about as well as a toad trying to cross the freeway during rush hour