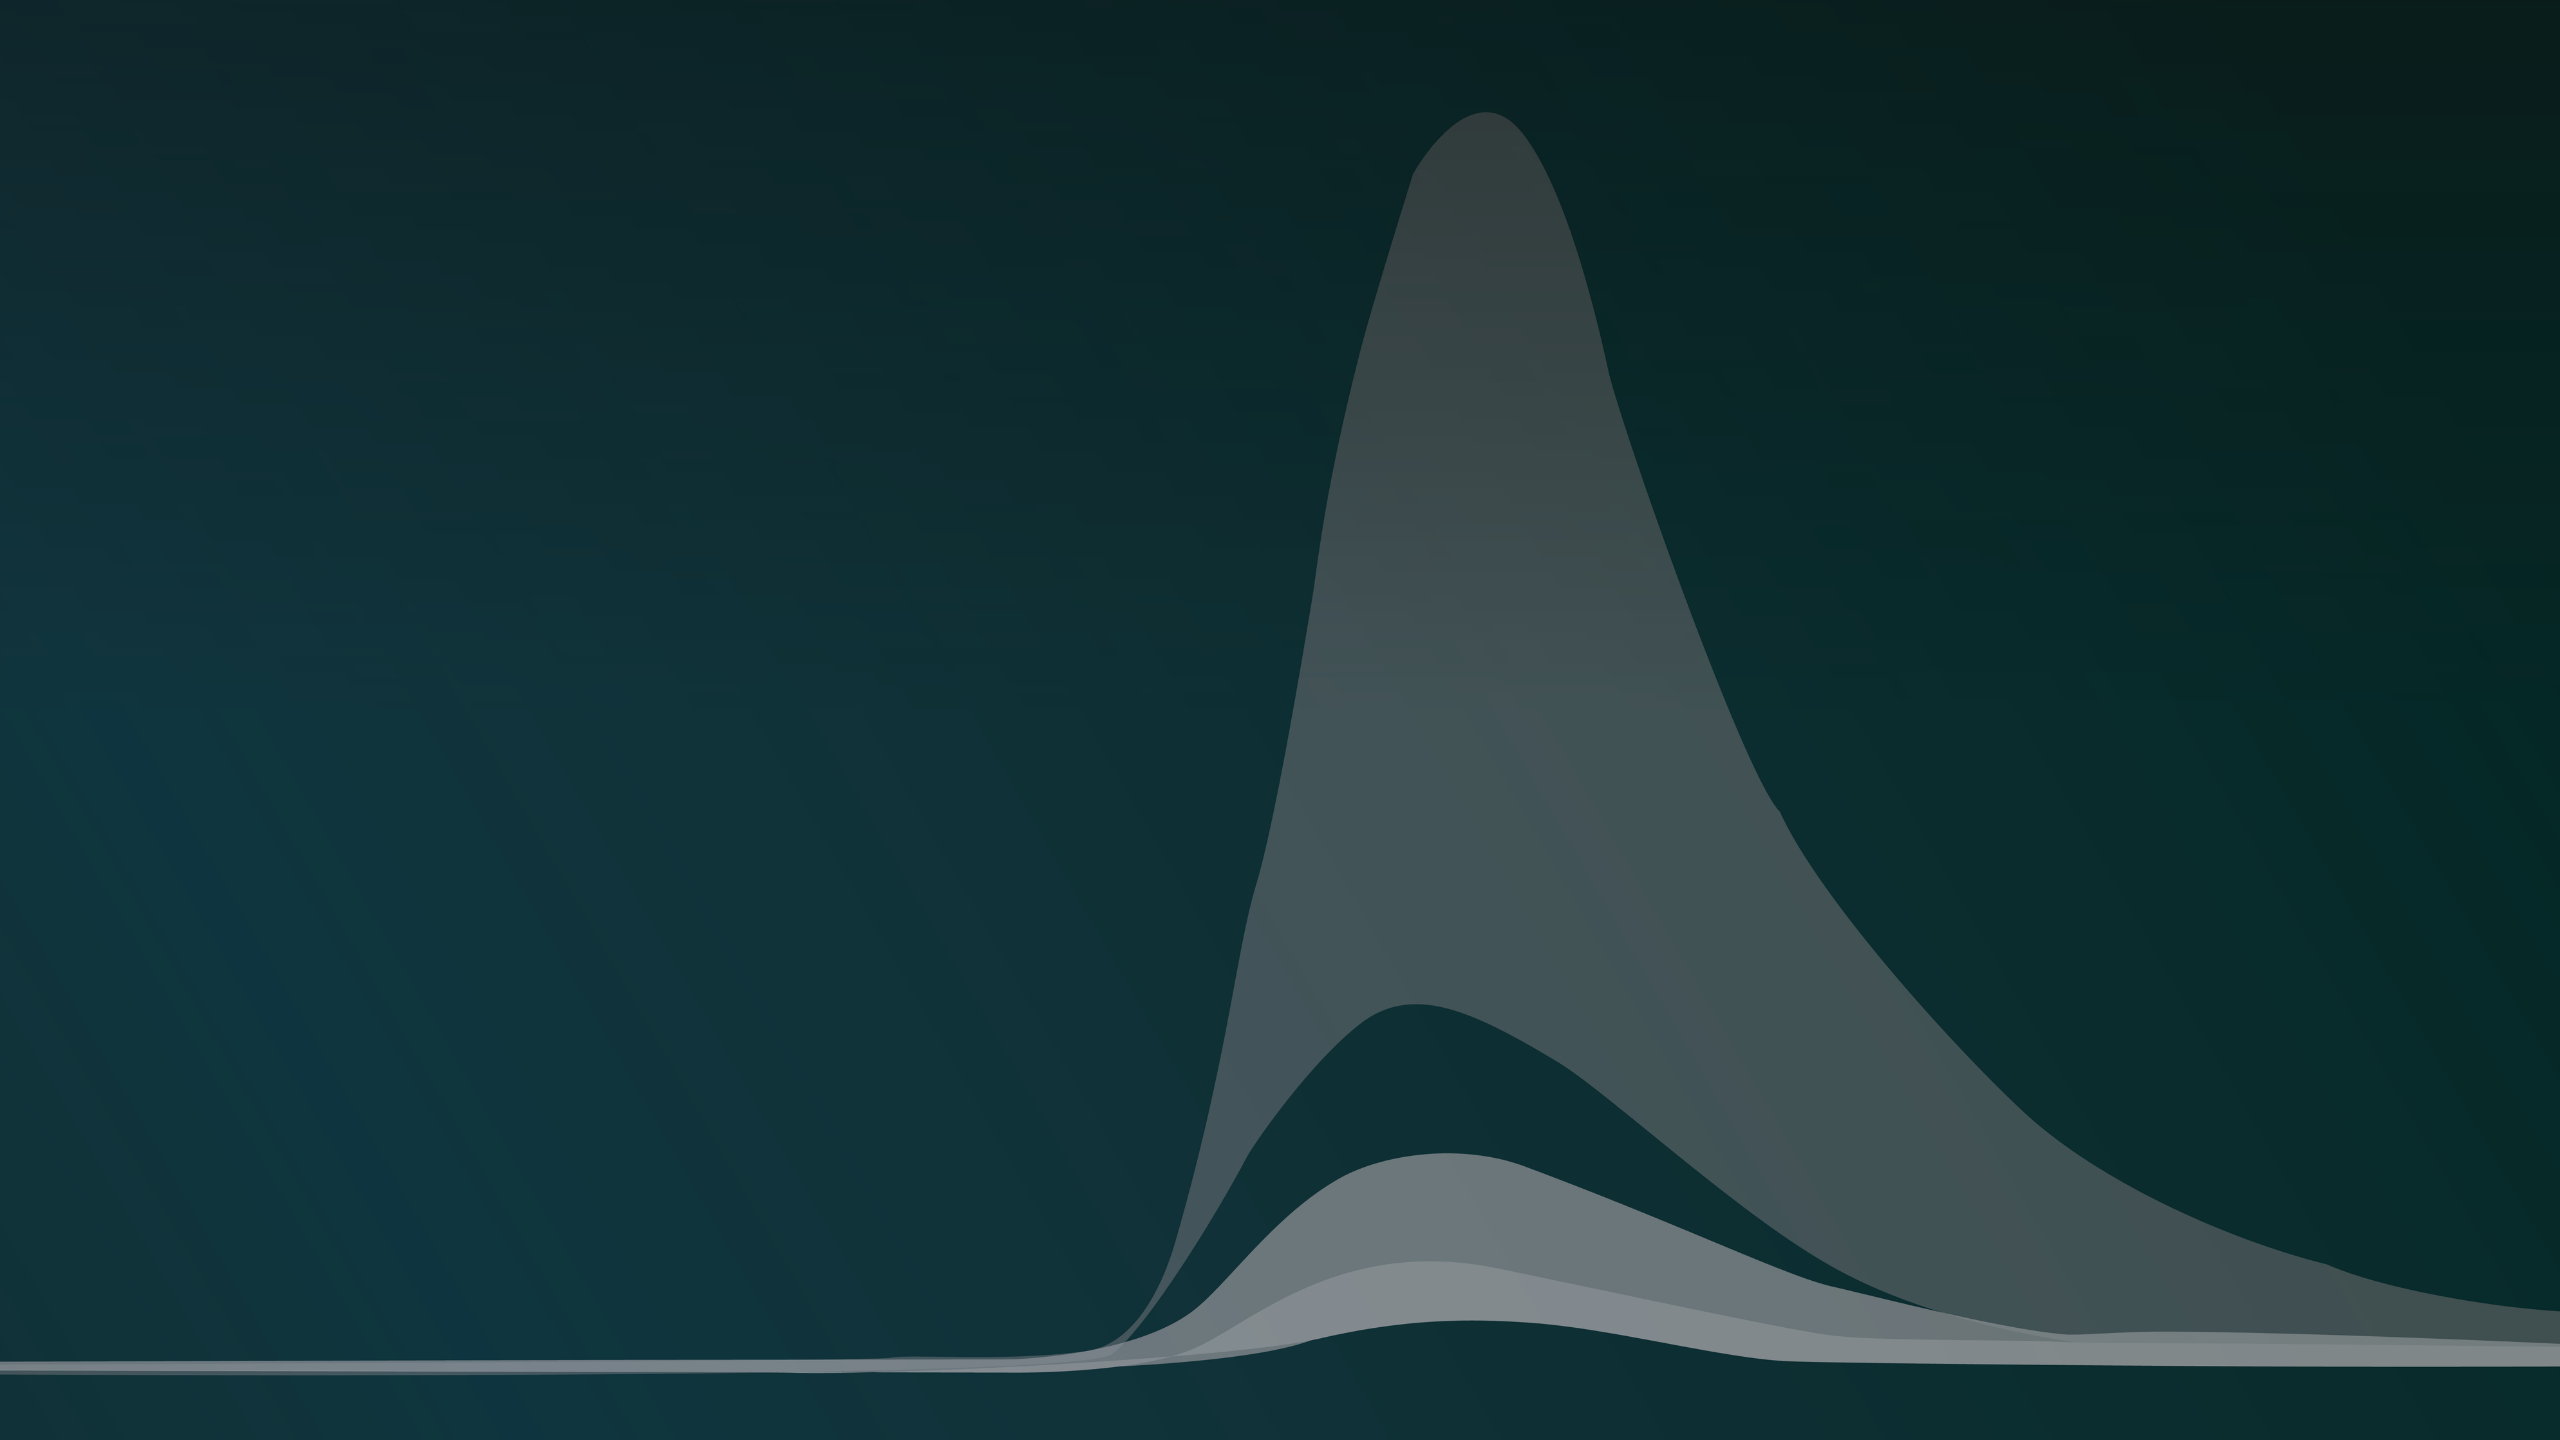
Official CDC projections for COVID -- Updated regularly..

total deaths so far, COVID19 vrs flu.

View attachment 336452

What is the latest on the Covid deaths from the protest population?
we'll need another few weeks to know that....

estimated deaths of everyone, including the protesters estimated deaths, and reopening of economy, and ending the shelter at home, is now 215,000 dead BY SEPTEMBER announced today.... another 100k killed by sept...

and imo, likely 400k dead from it, by year end.... unless a miracle happens....
 
estimated deaths of everyone, including the protesters estimated deaths, and reopening of economy, and ending the shelter at home, is now 215,000 dead BY SEPTEMBER announced today.... another 100k killed by sept...
and imo, likely 400k dead from it, by year end.... unless a miracle happens....
I doubt it is going to get that bad, as we have found some effective treatment and the death rate is dropping

1591836771224.png
 
estimated deaths of everyone, including the protesters estimated deaths, and reopening of economy, and ending the shelter at home, is now 215,000 dead BY SEPTEMBER announced today.... another 100k killed by sept...
and imo, likely 400k dead from it, by year end.... unless a miracle happens....
I doubt it is going to get that bad, as we have found some effective treatment and the death rate is dropping

View attachment 348616
but if you look at the numbers, without new york/NJ who are dropping drastically at this point in their curve, might be affecting the overall numbers to appear better than they are,

I think they might be rising in many, of the other states....

my 400k by end year, is likely going to be greater than that, unless people start taking this wearing a mask, and 6 ft of separation when indoors, seriously.... hope I'm wrong, but it doesn't look like it....

That's faulty. While numbers in NJ and NY have fallen drastically since their peaks, the decline in both States is bottoming out, that is, the numbers are no longer falling drastically.

On the other hand, you are right. In the overall numbers, falling numbers in some States are obscuring rising numbers in other States - see Texas, Arizona, or Arkansas, for instance. Moreover, as the country is opening up, and folks are resuming their normal travel habits, the risk of spread between States is rising exponentially. That means, tragically, that States with incompetent or reckless leadership are putting States at risk that have successfully contained the virus.

As of yet, the number of new cases and the number of deaths are falling, overall. That may - MAY - be because folks are taking it seriously, and behave reasonably to protect themselves and others. Absent national leadership, it remains to be seen whether that's enough. I, for one, am not overly confident.
 
Starting to see possible "disinformation" on COVID numbers.. To my knowledge, ALL physician, medical statistics on epidemics are reported THRU the CDC... So whether that information is FULLY correct, does not matter as much as information that "suddenly appears" from some random sites that might be linked to other countries efforts to "quiet us down" or "rile us up"...

Apologies to anyone that posted this link already.. Saw it yesterday and the gist is --- Most states and the country are gonna PEAK Mid-April... With "out of the wood" being maybe mid May... When you READ the graphs, realized they are MODELS.. So the solid lines are the BEST EXPECTATIONS... The color shaded areas are measures of UNCERTAINTY...

Like for the Entire US graph --- the uncertainties run kinda high because of not knowing how many OTHER major population areas will be hit -- etc... But if you drill down to "mild states" -- the timeframe is the same, but the uncertainty is almost negligible...

Here's the site -- it's an ORG associated with CDC.. Stay well and don't panic.

Why are you posting nonsense from the CDC that gets funded by the dollar a pack cigarette tax knowing that tobacco kills 1300 or more Americans every single day? The CDC also told us that wearing masks was not needed for any reason...............

It's not ideal nor is it REALLY accurate as Dr. Birx of CDC herself has pointed out.. But that's where ALL medical services are ORDERED to send their "infectious disease reports"... Not a fan of govt numbers of ANY KIND -- but nobody else has a LAW behind them making THEM the chief "reportin g agency" on epidemics...

And the DATA ITSELF -- is all locally generated all around the country with different policies and definitions of a "covid case or death"...

It's all we got.. Is the answer...
 
My estimate (assuming we are still trending up and 3.4% death rate) is a whopping 309,332 by June 15th.

Well, I got egg on my face, but I think it means that we are trending down. While 118,000+ deaths is nothing to sneeze at (no pun intended), it does mean that we aren't going at a 3.4% rate using the current death rate.

Assuming your state isn't one of low exposure and hasn't been shelter in place, then the ones who have been shelter in place should be loosening the reins now and letting people go back to work, opening restaurants, hair salons, and close personal services more. It may not be dine in place or is limited, but it has to be more than curbside p/u or delivery.

What do you think? Will you go out more and try dining out if restrictions are in place? Are you back at work? For women, did you get your hair styled, nails done, and more? What about guys -- hair cut or something more?

I retired early and got a job doing essential services so the money situation isn't bad. I got my dogs groomed for the summer haha.
 
Starting to see possible "disinformation" on COVID numbers.. To my knowledge, ALL physician, medical statistics on epidemics are reported THRU the CDC... So whether that information is FULLY correct, does not matter as much as information that "suddenly appears" from some random sites that might be linked to other countries efforts to "quiet us down" or "rile us up"...

Apologies to anyone that posted this link already.. Saw it yesterday and the gist is --- Most states and the country are gonna PEAK Mid-April... With "out of the wood" being maybe mid May... When you READ the graphs, realized they are MODELS.. So the solid lines are the BEST EXPECTATIONS... The color shaded areas are measures of UNCERTAINTY...

Like for the Entire US graph --- the uncertainties run kinda high because of not knowing how many OTHER major population areas will be hit -- etc... But if you drill down to "mild states" -- the timeframe is the same, but the uncertainty is almost negligible...

Here's the site -- it's an ORG associated with CDC.. Stay well and don't panic.

Why are you posting nonsense from the CDC that gets funded by the dollar a pack cigarette tax knowing that tobacco kills 1300 or more Americans every single day? The CDC also told us that wearing masks was not needed for any reason...............
Who's numbers would you like to post? I'm not a fan of the cdc but this paranoia has to stop and we have to start thinking somewhere.
The CDC is funded by tobacco sales that kill 1,300 Americans every single day. You will resume thinking when you take that dopey mask off and get some Oxygen back in your brain
 
Well, I got egg on my face, but I think it means that we are trending down. While 118,000+ deaths is nothing to sneeze at (no pun intended), it does mean that we aren't going at a 3.4% rate using the current death rate.

You're about even with Dr Fauci who was STILL downplaying this whole thing in early MArch..., LOTS of folks -- got it wrong and did not learn and some are STILL getting it wrong,....

Mortality rate is WAY down because CDC/WHO underestimated the infection rate by almost a factor of 20....
 
The CDC and FDA are both political jokes. They're deep staters whose #1 job is to sway the media politically. You can't believe a word they say. We should defund those assholes.
 
Not exactly fake news:

COVID-19 Heat Shock Protein 70
'....viruses induce the stress response reaction in infected cells. HSPs (heat shock proteins) are known as stress proteins in physiological activities and also act as molecular chaperones that stabilize unfolded protein....especially hsp70 are stimulated by viral infections leading to increase in viral gene expression.'

HSP70 'Hot' Mitochondrion
 
#238: That's right. So what we've found for the link between hydroxychloroquine and parasites of Chrysemys has a scientific basis. It's not wise to dismiss the credibility of a Los Alamos report about COVID-19.
 
total deaths so far, COVID19 vrs flu.

View attachment 336452

Except, this is a lie by CDC and Washington Post.

This week CDC quietly updated the COVID numbers to admit that only 6% of all deaths recorder actually died from COVID. Meaning, out of 189,000 only 11,300 are dead from COVID, and the other 94% were from other serious illnesses and old people.
 

Forum List

Back
Top