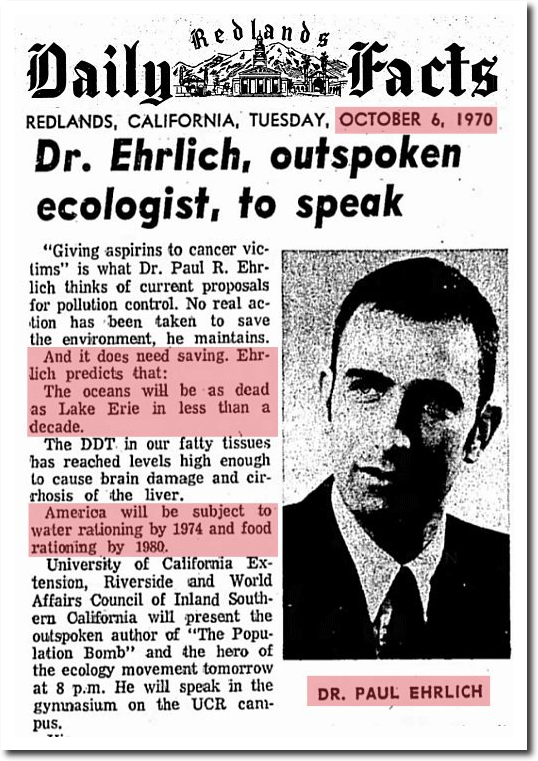
From Wikipedia's article on Dr Ball
Timothy Francis Ball (November 5, 1938 – September 24, 2022) was a British-born Canadian public speaker and writer who was a professor in the Department of Geography at the
University of Winnipeg from 1971 until his retirement in 1996. Ball then became very active in promoting rejection of the
scientific consensus on global warming, giving public talks and writing opinion pieces and letters to the editor for Canadian newspapers. He has been a member of energy industry funded lobbying groups.
Ball's expertise in chemistry and physics is ZERO. Ball is funded by the energy industry and has been for years. -- OP
Maurice Frederick Strong,
PC,
CC,
OM,
FRSC,
FRAIC (April 29, 1929 – November 27, 2015) was a Canadian oil and mineral businessman and a diplomat who served as
Under-Secretary-General of the United Nations.
[4][5][6]
Strong had his start as an entrepreneur in the Alberta oil patch and was President of
Power Corporation of Canada until 1966. In the early 1970s he was Secretary General of the
United Nations Conference on the Human Environment and then became the first executive director of the
United Nations Environment Programme. He returned to Canada to become Chief Executive Officer of
Petro-Canada from 1976 to 1978. He headed
Ontario Hydro, one of North America's largest power utilities, was national president and chairman of the Extension Committee of the World Alliance of
YMCAs, and headed
American Water Development Incorporated. He served as a commissioner of the
World Commission on Environment and Development in 1986
[7] and was recognised by the
International Union for Conservation of Nature as a leader in the international environmental movement.
[8]
He was President of the Council of the
University for Peace from 1998 to 2006. More recently Strong was an active honorary professor at
Peking University and honorary chairman of its Environmental Foundation. He was chairman of the advisory board for the Institute for Research on Security and Sustainability for Northeast Asia.
[9] He died at the age of 86 in 2015.[10]
Dewar, Elaine 1948- (Elaine Ruth Dewar)
PERSONAL:
Born June 18, 1948, in Saskatoon, Saskatchewan, Canada; daughter of Sam (a physician) and Petty Sarah Landa; married Stephen Dewar, June 1, 1969; children: Anna Esther, Danielle Sarah Nicole.
Education: Attended Nutana Collegiate and York University;
University of Toronto, B.A., 1970. Religion: Jewish.
Hobbies and other interests: Swimming, tennis, drawing, reading.
CAREER:
Me and My Friends Gallery, founder, 1970-72;
Maclean's, researcher, assistant editor, and associate editor, 1973-77; freelance journalist, editor, and story editor, 1977—;
City Woman (magazine), contributing editor, 1978-82;
Lorne Green's New Wilderness, writer and story editor, 1982-85;
Toronto Life (magazine), contributing editor, 1984-94; Ryerson Polytechnical Institute, instructor in magazine journalism, 1985-86; Dewar Productions, Inc., director and vice president, 1988—; Writers to Reform Libel Law, cofounder, 1990—.
AWARDS, HONORS:
York University Gold Medal for Outstanding Academic Achievement in English Literature, University of Toronto; A.C. Forrest Memorial Award; Mutual Life of Canada Award for business writing; Jackman Foundation Award for investigative journalism; University of Western Ontario President's Medal; Outdoor Writer's Association of America Two-Star Award; Foundation for the Advancement of Canadian Letters Author's Award; University of Kansas School of Journalism White Award for investigative journalism.
WRITINGS:
Cloak of Green, J. Lorimer (Toronto, Ontario, Canada), 1995.
Bones: Discovering the First Americans, Random House Canada (Toronto, Ontario, Canada), 2001.
The Second Tree: Of Clones, Chimeras and Quests for Immortality, Carroll & Graf (
New York, NY), 2004.
SIDELIGHTS:
Elaine Dewar is a Canadian investigative journalist and nonfiction science writer. In
Cloak of Green, she presents a study of the environmental movement in various places around the world. She states in her book that, like many other organizations, the environmental movement is connected to government agencies and businesses, and it works to promote and protect its own interests. Dewar also theorizes that environmental groups are linked in a conspiratorial effort to destroy nationalism and create a new world order, which the author calls the "Global Governance Agenda."
But it is one being significantly altered by human activities, hitting levels never seen by homo sapiens and not seen on Earth for well over a million years. Water vapor, being a precipitable component, will not be directly increased by human activity.
Volume proportion is not what determines the amount of energy trapped by a greenhouse gas. Water vapor retains more IR than does CO2 but it is not changing. The warming of the planet is being caused by human activity increasing the level of atmsopheric CO2 a gas with a lifetime measured in centuries. What water vapor, with a lifetime measured in days, does, is basically irrelevant. It is not responsible for the observed warming. It will not ameliorate the observed warming.
Methane is exceedingly potent as a greenhouse gas. Fortunately, its lifetime is only about 12 years and it is at much lower levels than CO2. Look at the table below and compare the proportion of greenhouse warming of each gas to their absolute levels in the atmosphere. Do you not see that arguments that try to tell you that CO2 and methane can't hurt us because their levels are so small are just bullshit attempting to take advantage of the general science ignorance of the audience they're targeting?
All of these gases are being created and emitted by human activities
This comment that that the range of a parameter makes the information useless has become a very popular denier meme. The truth is, it makes it obvious that the IPCC is being honest and accurate while you and Tim Ball and WUWT are not. Here is a larger excerpt from the Wikipedia article on "Greenhouse gas"
Impacts on the overall greenhouse effect
Main article:
Greenhouse effect

Schmidt et al. (2010)
[28] analyzed how individual components of the atmosphere contribute to the total greenhouse effect. They estimated that water vapor accounts for about 50% of Earth's greenhouse effect, with clouds contributing 25%, carbon dioxide 20%, and the minor greenhouse gases and
aerosols accounting for the remaining 5%. In the study, the reference model atmosphere is for 1980 conditions. Image credit:
NASA.
[29]
The contribution of each gas to the greenhouse effect is determined by the characteristics of that gas, its abundance, and any indirect effects it may cause. For example, the direct radiative effect of a mass of methane is about 84 times stronger than the same mass of carbon dioxide over a 20-year time frame
[30] but it is present in much smaller concentrations so that its total direct radiative effect has so far been smaller, in part due to its shorter atmospheric lifetime in the absence of additional
carbon sequestration. On the other hand, in addition to its direct radiative impact, methane has a large, indirect radiative effect because it contributes to ozone formation. Shindell et al. (2005)
[31] argues that the contribution to climate change from methane is at least double previous estimates as a result of this effect.
[32]
When ranked by their direct contribution to the greenhouse effect, the most important are:
[27]
notes:
(A) Water vapor strongly varies locally[34]
(B) The concentration in stratosphere. About 90% of the ozone in Earth's atmosphere is contained in the stratosphere. | | | |
|---|
| Compound | Formula | Concentration in
atmosphere[33] (ppm) | Contribution
(%) |
|---|
| Water vapor and clouds | H
2O | 10–50,000(A) | 36–72% |
| Carbon dioxide | CO2 | ~400 | 9–26% |
| Methane | CH
4 | ~1.8 | 4–9% |
| Ozone | O
3 | 2–8(B) | 3–7% |
In addition to the main greenhouse gases listed above, other greenhouse gases include
sulfur hexafluoride,
hydrofluorocarbons and
perfluorocarbons (see
IPCC list of greenhouse gases). Some greenhouse gases are not often listed. For example,
nitrogen trifluoride has a high
global warming potential (GWP) but is only present in very small quantities.
[35]
References
- ^ Jump up to:a b "IPCC AR4 SYR Appendix Glossary" (PDF). Archived from the original (PDF) on 17 November 2018. Retrieved 14 December 2008.
- ^ "NASA GISS: Science Briefs: Greenhouse Gases: Refining the Role of Carbon Dioxide". www.giss.nasa.gov. Archived from the original on 12 January 2005. Retrieved 26 April 2016.
- ^ Karl TR, Trenberth KE (2003). "Modern global climate change". Science. 302 (5651): 1719–23. Bibcode:2003Sci...302.1719K. doi:10.1126/science.1090228. PMID 14657489. S2CID 45484084. Archived from the original on 22 April 2021. Retrieved 26 July 2019.
- ^ Le Treut H.; Somerville R.; Cubasch U.; Ding Y.; Mauritzen C.; Mokssit A.; Peterson T.; Prather M. Historical overview of climate change science (PDF). Archived (PDF) from the original on 26 November 2018. Retrieved 14 December 2008. in IPCC AR4 WG1 (2007)
- ^ "NASA Science Mission Directorate article on the water cycle". Nasascience.nasa.gov. Archived from the original on 17 January 2009. Retrieved 16 October 2010.
- ^ Eddie Schwieterman. "Comparing the Greenhouse Effect on Earth, Mars, Venus, and Titan: Present Day and through Time" (PDF). Archived from the original (PDF) on 30 January 2015.
- ^ Jump up to:a b "Carbon dioxide now more than 50% higher than pre-industrial levels". National Oceanic and Atmospheric Administration. 3 June 2022. Retrieved 30 August 2022.
- ^ "Climate Change: Atmospheric Carbon Dioxide | NOAA Climate.gov". www.climate.gov. Archived from the original on 24 June 2013. Retrieved 2 March 2020.
- ^ "Frequently asked global change questions". Carbon Dioxide Information Analysis Center. Archived from the original on 17 August 2011. Retrieved 23 February 2010.
- ^ ESRL Web Team (14 January 2008). "Trends in carbon dioxide". Esrl.noaa.gov. Archived from the original on 25 December 2018. Retrieved 11 September 2011.
- ^ "Analysis: When might the world exceed 1.5C and 2C of global warming?". Carbon Brief. 4 December 2020. Archived from the original on 6 June 2021. Retrieved 17 June 2021.
- ^ IPCC AR6 WG1 Ch5 2021, Sec 5.2.1.1
- ^ "Global Greenhouse Gas Emissions Data". U.S. Environmental Protection Agency. 12 January 2016. Archived from the original on 5 December 2019. Retrieved 30 December 2019. The burning of coal, natural gas, and oil for electricity and heat is the largest single source of global greenhouse gas emissions.
- ^ "AR4 SYR Synthesis Report Summary for Policymakers – 2 Causes of change". ipcc.ch. Archived from the original on 28 February 2018. Retrieved 9 October 2015.
- ^ Höpfner, M.; Milz, M.; Buehler, S.; Orphall, J.; Stiller, G. (24 May 2012). "The natural greenhouse effect of atmospheric oxygen (O2) and nitrogen (N2)". Geophysical Research Letters. 39 (L10706). Bibcode:2012GeoRL..3910706H. doi:10.1029/2012GL051409. ISSN 1944-8007. S2CID 128823108.
- ^ "Atmospheric Concentration of Greenhouse Gases" (PDF). U.S. Environmental Protection Agency. 1 August 2016. Archived (PDF) from the original on 19 October 2021. Retrieved 6 September 2021.
- ^ "Inside the Earth's invisible blanket". sequestration.org. Archived from the original on 28 July 2020. Retrieved 5 March 2021.
- ^ "FAQ 7.1". p. 14. in IPCC AR4 WG1 (2007)
- ^ Canadell, J.G.; Le Quere, C.; Raupach, M.R.; Field, C.B.; Buitenhuis, E.T.; Ciais, P.; Conway, T.J.; Gillett, N.P.; Houghton, R.A.; Marland, G. (2007). "Contributions to accelerating atmospheric CO2 growth from economic activity, carbon intensity, and efficiency of natural sinks". Proc. Natl. Acad. Sci. USA. 104 (47): 18866–70. Bibcode:2007PNAS..10418866C. doi:10.1073/pnas.0702737104. PMC 2141868. PMID 17962418.
- ^ "The Chemistry of Earth's Atmosphere". Earth Observatory. NASA. Archived from the original on 20 September 2008.
- ^ Jump up to:a b Forster, P.; et al. (2007). "2.10.3 Indirect GWPs". Changes in Atmospheric Constituents and in Radiative Forcing. Contribution of Working Group I to the Fourth Assessment Report of the Intergovernmental Panel on Climate Change. Cambridge University Press. Archived from the original on 9 February 2019. Retrieved 2 December 2012.
- ^ MacCarty, N. "Laboratory Comparison of the Global-Warming Potential of Six Categories of Biomass Cooking Stoves" (PDF). Approvecho Research Center. Archived from the original (PDF) on 11 November 2013.
- ^ Jump up to:a b c "Water vapour: feedback or forcing?". RealClimate. 6 April 2005. Archived from the original on 24 June 2007. Retrieved 1 May 2006.
- ^ Jump up to:a b Held, Isaac M.; Soden, Brian J. (November 2000). "Water vapor feedback and global warming". Annual Review of Energy and the Environment. 25 (1): 441–475. CiteSeerX 10.1.1.22.9397. doi:10.1146/annurev.energy.25.1.441. ISSN 1056-3466.
- ^ Evans, Kimberly Masters (2005). "The greenhouse effect and climate change". The environment: a revolution in attitudes. Detroit: Thomson Gale. ISBN 978-0787690823.
- ^ "Inventory of U.S. Greenhouse Gas Emissions and Sinks: 1990–2010". U.S. Environmental Protection Agency. 15 April 2012. p. 1.4. Archived from the original on 30 December 2019. Retrieved 30 December 2019.
- ^ Jump up to:a b c Kiehl, J.T.; Kevin E. Trenberth (1997). "Earth's annual global mean energy budget". Bulletin of the American Meteorological Society. 78 (2): 197–208. Bibcode:1997BAMS...78..197K. doi:10.1175/1520-0477(1997)078<0197:EAGMEB>2.0.CO;2.
- ^ Schmidt, G.A.; R. Ruedy; R.L. Miller; A.A. Lacis (2010), "The attribution of the present-day total greenhouse effect" (PDF), J. Geophys. Res., vol. 115, no. D20, pp. D20106, Bibcode:2010JGRD..11520106S, doi:10.1029/2010JD014287, archived from the original (PDF) on 22 October 2011, D20106. Web page Archived 4 June 2012 at the Wayback Machine
- ^ Lacis, A. (October 2010), NASA GISS: CO2: The Thermostat that Controls Earth's Temperature, New York: NASA GISS, archived from the original on 20 October 2010
- ^ Jump up to:a b c d e f g "Appendix 8.A" (PDF). Intergovernmental Panel on Climate Change Fifth Assessment Report. p. 731. Archived (PDF) from the original on 13 October 2017. Retrieved 6 November 2017.
- ^ Shindell, Drew T. (2005). "An emissions-based view of climate forcing by methane and tropospheric ozone". Geophysical Research Letters. 32 (4): L04803. Bibcode:2005GeoRL..32.4803S. doi:10.1029/2004GL021900. S2CID 129022003. Archived from the original on 11 September 2005. Retrieved 3 September 2005.
- ^ "Methane's Impacts on Climate Change May Be Twice Previous Estimates". Nasa.gov. 30 November 2007. Archived from the original on 11 September 2005. Retrieved 16 October 2010.
- ^ "Climate Change Indicators: Atmospheric Concentrations of Greenhouse Gases". Climate Change Indicators. United States Environmental Protection Agency. 27 June 2016. Archived from the original on 30 April 2016. Retrieved 20 January 2017.
- ^ Wallace, John M. and Peter V. Hobbs. Atmospheric Science; An Introductory Survey. Elsevier. Second Edition, 2006. ISBN 978-0127329512. Chapter 1
- ^ Prather, Michael J.; J Hsu (2008). "NF3, the greenhouse gas missing from Kyoto". Geophysical Research Letters. 35 (12): L12810. Bibcode:2008GeoRL..3512810P. doi:10.1029/2008GL034542. Archived from the original on 23 September 2019. Retrieved 23 September 2019.
- ^ Isaksen, Ivar S.A.; Michael Gauss; Gunnar Myhre; Katey M. Walter Anthony; Carolyn Ruppel (20 April 2011). "Strong atmospheric chemistry feedback to climate warming from Arctic methane emissions" (PDF). Global Biogeochemical Cycles. 25 (2): n/a. Bibcode:2011GBioC..25.2002I. doi:10.1029/2010GB003845. hdl:1912/4553. S2CID 17810925. Archived from the original (PDF) on 4 March 2016. Retrieved 29 July 2011.
- ^ "AGU Water Vapor in the Climate System". Eso.org. 27 April 1995. Archived from the original on 20 October 2012. Retrieved 11 September 2011.
- ^ Betts (2001). "6.3 Well-mixed Greenhouse Gases". Chapter 6 Radiative Forcing of Climate Change. Working Group I: The Scientific Basis IPCC Third Assessment Report – Climate Change 2001. UNEP/GRID-Arendal – Publications. Archived from the original on 29 June 2011. Retrieved 16 October 2010.
- ^ Jump up to:a b Jacob, Daniel (1999). Introduction to atmospheric chemistry. Princeton University Press. pp. 25–26. ISBN 978-0691001852. Archived from the original on 2 September 2011.
- ^ "How long will global warming last?". RealClimate. 15 March 2005. Archived from the original on 4 March 2021. Retrieved 12 June 2012.
- ^ Jump up to:a b IPCC AR6 WG1 2021, Annex VII - Glossary
- ^ "Frequently Asked Question 10.3: If emissions of greenhouse gases are reduced, how quickly do their concentrations in the atmosphere decrease?". Global Climate Projections. Archived from the original on 24 December 2011. Retrieved 1 June 2011. in IPCC AR4 WG1 (2007)
- ^ See also: Archer, David (2005). "Fate of fossil fuel CO2 in geologic time" (PDF). Journal of Geophysical Research. 110 (C9): C09S05.1–6. Bibcode:2005JGRC..11009S05A. doi:10.1029/2004JC002625. Archived (PDF) from the original on 19 December 2005. Retrieved 27 July 2007.
- ^ See also: Caldeira, Ken; Wickett, Michael E. (2005). "Ocean model predictions of chemistry changes from carbon dioxide emissions to the atmosphere and ocean" (PDF). Journal of Geophysical Research. 110 (C9): C09S04.1–12. Bibcode:2005JGRC..11009S04C. doi:10.1029/2004JC002671. Archived from the original (PDF) on 10 August 2007. Retrieved 27 July 2007.
- ^ "Annual Greenhouse Gas Index". U.S. Global Change Research Program. Archived from the original on 21 April 2021. Retrieved 5 September 2020.
- ^ Jump up to:a b Butler J. and Montzka S. (2020). "The NOAA Annual Greenhouse Gas Index (AGGI)". NOAA Global Monitoring Laboratory/Earth System Research Laboratories. Archived from the original on 22 September 2013. Retrieved 5 September 2020.
- ^ Jump up to:a b "Climate Change Indicators in the United States - Greenhouse Gases". U.S. Environmental Protection Agency (EPA). 2016. Archived from the original on 27 August 2016. Retrieved 5 September 2020..
- ^ "Climate Change Indicators: Greenhouse Gases". U.S. Environmental Protection Agency (EPA). 2022. Retrieved 22 October 2022.
- ^ "Climate Change Indicators in the United States - Climate Forcing". U.S. Environmental Protection Agency (EPA). 2016. Archived from the original on 27 August 2016. Retrieved 5 September 2020.[1] Archived 21 September 2020 at the Wayback Machine
- ^ LuAnn Dahlman (14 August 2020). "Climate change: annual greenhouse gas index". NOAA Climate.gov science news & Information for a climate smart nation. Archived from the original on 16 August 2013. Retrieved 5 September 2020.
- ^ "The NOAA Annual Greenhouse Gas Index (AGGI) - An Introduction". NOAA Global Monitoring Laboratory/Earth System Research Laboratories. Archived from the original on 27 November 2020. Retrieved 5 September 2020.
- ^ Jump up to:a b c d e f g IPCC AR6 WG1 Ch7 2021, Table 7.15
- ^ Chandler, David L. "How to count methane emissions". MIT News. Archived from the original on 16 January 2015. Retrieved 20 August 2018. Referenced paper is Trancik, Jessika; Edwards, Morgan (25 April 2014). "Climate impacts of energy technologies depend on emissions timing" (PDF). Nature Climate Change. 4 (5): 347. Bibcode:2014NatCC...4..347E. doi:10.1038/nclimate2204. hdl:1721.1/96138. Archived from the original (PDF) on 16 January 2015. Retrieved 15 January 2015.
- ^ "Table 2.14" (PDF). IPCC Fourth Assessment Report. p. 212. Archived (PDF) from the original on 15 December 2007. Retrieved 16 December 2008.
- ^ Vaara, Miska (2003), Use of ozone depleting substances in laboratories, TemaNord, p. 170, ISBN 978-9289308847, archived from the original on 6 August 2011
- ^ Montreal Protocol
- ^ Jump up to:a b Blasing (2013)
- ^ Jump up to:a b c Ehhalt, D.; et al., "Table 4.1", Atmospheric Chemistry and Greenhouse Gases, archived from the original on 3 January 2013, in IPCC TAR WG1 (2001), pp. 244–45. Referred to by: Blasing (2013). Based on Blasing (2013): Pre-1750 concentrations of CH4,N2O and current concentrations of O3, are taken from Table 4.1 (a) of the IPCC Intergovernmental Panel on Climate Change, 2001. Following the convention of IPCC (2001), inferred global-scale trace-gas concentrations from prior to 1750 are assumed to be practically uninfluenced by human activities such as increasingly specialized agriculture, land clearing, and combustion of fossil fuels. Preindustrial concentrations of industrially manufactured compounds are given as zero. The short atmospheric lifetime of ozone (hours-days) together with the spatial variability of its sources precludes a globally or vertically homogeneous distribution, so that a fractional unit such as parts per billion would not apply over a range of altitudes or geographical locations. Therefore a different unit is used to integrate the varying concentrations of ozone in the vertical dimension over a unit area, and the results can then be averaged globally. This unit is called a Dobson Unit (D.U.), after G.M.B. Dobson, one of the first investigators of atmospheric ozone. A Dobson unit is the amount of ozone in a column that, unmixed with the rest of the atmosphere, would be 10 micrometers thick at standard temperature and pressure.
- ^ Because atmospheric concentrations of most gases tend to vary systematically over the course of a year, figures given represent averages over a 12-month period for all gases except ozone (O3), for which a current global value has been estimated (IPCC, 2001, Table 4.1a). CO2 averages for year 2012 are taken from the National Oceanic and Atmospheric Administration, Earth System Research Laboratory, web site: www.esrl.noaa.gov/gmd/ccgg/trends maintained by Dr. Pieter Tans. For other chemical species, the values given are averages for 2011. These data are found on the CDIAC AGAGE web site: http://cdiac.ornl.gov/ndps/alegage.html Archived 21 January 2013 at the Wayback Machine or the AGAGE home page: http://agage.eas.gatech.edu Archived 7 January 2015 at the Wayback Machine.
- ^ Jump up to:a b Forster, P.; et al., "Table 2.1", Changes in Atmospheric Constituents and in Radiative Forcing, archived from the original on 12 October 2012, retrieved 30 October 2012, in IPCC AR4 WG1 (2007), p. 141. Referred to by: Blasing (2013)
- ^ Prentice, I.C.; et al. "Executive summary". The Carbon Cycle and Atmospheric Carbon Dioxide. Archived from the original on 7 December 2009., in IPCC TAR WG1 (2001), p. 185. Referred to by: Blasing (2013)
- ^ "Carbon dioxide levels continue at record levels, despite COVID-19 lockdown". WMO.int. World Meteorological Organization. 23 November 2020. Archived from the original on 1 December 2020.
- ^ IPCC AR4 WG1 (2007), p. 140:"The simple formulae ... in Ramaswamy et al. (2001) are still valid. and give an RF of +3.7 W m–2 for a doubling in the CO2 mixing ratio. ... RF increases logarithmically with mixing ratio" Calculation: ln(new ppm/old ppm)/ln(2)*3.7
- ^ ppb = parts-per-billion
- ^ Jump up to:a b c d The first value in a cell represents Mace Head, Ireland, a mid-latitude Northern-Hemisphere site, while the second value represents Cape Grim, Tasmania, a mid-latitude Southern-Hemisphere site. "Current" values given for these gases are annual arithmetic averages based on monthly background concentrations for year 2011. The SF
6 values are from the AGAGE gas chromatography – mass spectrometer (gc-ms) Medusa measuring system.
- ^ "Advanced Global Atmospheric Gases Experiment (AGAGE)". Archived from the original on 21 January 2013. Retrieved 30 October 2012. Data compiled from finer time scales in the Prinn; etc (2000). "ALE/GAGE/AGAGE database". Archived from the original on 21 January 2013. Retrieved 30 October 2012.
- ^ The pre-1750 value for N
2O is consistent with ice-core records from 10,000 BCE through 1750 CE: "Summary for policymakers", Figure SPM.1, IPCC, archived from the original on 2 November 2018, retrieved 30 October 2012, in IPCC AR4 WG1 (2007), p. 3. Referred to by: Blasing (2013)
- ^ Changes in stratospheric ozone have resulted in a decrease in radiative forcing of 0.05 W/m2: Forster, P.; et al., "Table 2.12", Changes in Atmospheric Constituents and in Radiative Forcing, archived from the original on 28 January 2013, retrieved 30 October 2012, in IPCC AR4 WG1 (2007), p. 204. Referred to by: Blasing (2013)
- ^ "SF
6 data from January 2004". Archived from the original on 21 January 2013. Retrieved 2 January 2013.
- ^ "Data from 1995 through 2004". National Oceanic and Atmospheric Administration (NOAA), Halogenated and other Atmospheric Trace Species (HATS).
- ^ Sturges, W.T.; et al. "Concentrations of SF
6 from 1970 through 1999, obtained from Antarctic firn (consolidated deep snow) air samples". Archived from the original on 21 January 2013. Retrieved 2 January 2013.
- ^ File
 hanerozoic Carbon Dioxide.png
- ^ Berner, Robert A. (January 1994). "GEOCARB II: a revised model of atmospheric CO2 over Phanerozoic time". American Journal of Science. 294 (1): 56–91. Bibcode:1994AmJS..294...56B. doi:10.2475/ajs.294.1.56.
- ^ Royer, D.L.; R.A. Berner; D.J. Beerling (2001). "Phanerozoic atmospheric CO2 change: evaluating geochemical and paleobiological approaches". Earth-Science Reviews. 54 (4): 349–92. Bibcode:2001ESRv...54..349R. doi:10.1016/S0012-8252(00)00042-8.
- ^ Berner, Robert A.; Kothavala, Zavareth (2001). "GEOCARB III: a revised model of atmospheric CO2 over Phanerozoic time" (PDF). American Journal of Science. 301 (2): 182–204. Bibcode:2001AmJS..301..182B. CiteSeerX 10.1.1.393.582. doi:10.2475/ajs.301.2.182. Archived (PDF) from the original on 25 April 2006.
- ^ Beerling, D.J.; Berner, R.A. (2005). "Feedbacks and the co-evolution of plants and atmospheric CO2". Proc. Natl. Acad. Sci. USA. 102 (5): 1302–05. Bibcode:2005PNAS..102.1302B. doi:10.1073/pnas.0408724102. PMC 547859. PMID 15668402.
- ^ Jump up to:a b Hoffmann, PF; AJ Kaufman; GP Halverson; DP Schrag (1998). "A neoproterozoic snowball earth". Science. 281 (5381): 1342–46. Bibcode:1998Sci...281.1342H. doi:10.1126/science.281.5381.1342. PMID 9721097. S2CID 13046760.
- ^ Siegel, Ethan. "How Much CO2 Does A Single Volcano Emit?". Forbes. Archived from the original on 6 June 2017. Retrieved 6 September 2018.
- ^ Gerlach, TM (1991). "Present-day CO2 emissions from volcanoes". Transactions of the American Geophysical Union. 72 (23): 249–55. Bibcode:1991EOSTr..72..249.. doi:10.1029/90EO10192.
- ^ See also: "U.S. Geological Survey". 14 June 2011. Archived from the original on 25 September 2012. Retrieved 15 October 2012.
- ^ Flückiger, Jacqueline (2002). "High-resolution Holocene N
2O ice core record and its relationship with CH
4 and CO2". Global Biogeochemical Cycles. 16 (1): 1010. Bibcode:2002GBioC..16.1010F. doi:10.1029/2001GB001417.
- ^ Friederike Wagner; Bent Aaby; Henk Visscher (2002). "Rapid atmospheric CO2 changes associated with the 8,200-years-B.P. cooling event". Proc. Natl. Acad. Sci. USA. 99 (19): 12011–14. Bibcode:2002PNAS...9912011W. doi:10.1073/pnas.182420699. PMC 129389. PMID 12202744.
- ^ Andreas Indermühle; Bernhard Stauffer; Thomas F. Stocker (1999). "Early Holocene Atmospheric CO2 Concentrations". Science. 286 (5446): 1815. doi:10.1126/science.286.5446.1815a. IndermÜhle, A (1999). "Early Holocene atmospheric CO2concentrations". Science. 286 (5446): 1815a–15. doi:10.1126/science.286.5446.1815a.
- ^ H. J. Smith; M. Wahlen; D. Mastroianni (1997). "The CO2 concentration of air trapped in GISP2 ice from the Last Glacial Maximum-Holocene transition". Geophysical Research Letters. 24 (1): 1–4. Bibcode:1997GeoRL..24....1S. doi:10.1029/96GL03700. S2CID 129667062.
- ^ Charles J. Kibert (2016). "Background". Sustainable Construction: Green Building Design and Delivery. Wiley. ISBN 978-1119055327.
- ^ "Full Mauna Loa CO2 record". Earth System Research Laboratory. 2005. Archived from the original on 28 April 2017. Retrieved 6 May 2017.
- ^ Tans, Pieter (3 May 2008). "Annual CO2 mole fraction increase (ppm) for 1959–2007". National Oceanic and Atmospheric Administration Earth System Research Laboratory, Global Monitoring Division. "additional details". Archived from the original on 25 December 2018. Retrieved 15 May 2008.; see also Masarie, K.A.; Tans, P.P. (1995). "Extension and integration of atmospheric carbon dioxide data into a globally consistent measurement record". J. Geophys. Res. 100 (D6): 11593–610. Bibcode:1995JGR...10011593M. doi:10.1029/95JD00859. Archived from the original on 8 March 2021. Retrieved 26 July 2019.
- ^ "Historical Overview of Climate Change Science – FAQ 1.3 Figure 1" (PDF). p. 116. Archived (PDF) from the original on 26 November 2018. Retrieved 25 April 2008. in IPCC AR4 WG1 (2007)
- ^ "Chapter 3, IPCC Special Report on Emissions Scenarios, 2000" (PDF). Intergovernmental Panel on Climate Change. 2000. Archived (PDF) from the original on 20 August 2018. Retrieved 16 October 2010.
- ^ Agriculture, Forestry, and Other Land Uses Ch7 from "Climate Change 2022: Mitigation of Climate Change". www.ipcc.ch. Retrieved 6 April 2022.
- ^ "Global Carbon Project (GCP)". www.globalcarbonproject.org. Archived from the original on 4 April 2019. Retrieved 19 May 2019.
- ^ Dumitru-Romulus Târziu; Victor-Dan Păcurar (January 2011). "Pădurea, climatul și energia". Rev. pădur. (in Romanian). 126 (1): 34–39. ISSN 1583-7890. 16720. Archived from the original on 16 April 2013. Retrieved 11 June 2012.(webpage has a translation button)
- ^ "Sixth Assessment Report". www.ipcc.ch. Retrieved 18 December 2021.
- ^ Evans, Simon (5 October 2021). "Analysis: Which countries are historically responsible for climate change? / Historical responsibility for climate change is at the heart of debates over climate justice". CarbonBrief.org. Carbon Brief. Archived from the original on 26 October 2021. Source: Carbon Brief analysis of figures from the Global Carbon Project, CDIAC, Our World in Data, Carbon Monitor, Houghton and Nassikas (2017) and Hansis et al (2015).
- ^ Fox, Alex. "Atmospheric Carbon Dioxide Reaches New High Despite Pandemic Emissions Reduction". Smithsonian Magazine. Retrieved 22 June 2021.
- ^ "The present carbon cycle – Climate Change". Grida.no. Retrieved 16 October 2010.
- ^ "Climate Change: Causation Archives". EarthCharts. Retrieved 22 June 2021.
- ^ "It's critical to tackle coal emissions – Analysis". IEA. Retrieved 9 October 2021.
- ^ Jump up to:a b "Geoengineering the climate: science, governance and uncertainty". The Royal Society. 2009. Archived from the original on 7 September 2009. Retrieved 12 September 2009.
- ^ Fischer, B.S.; Nakicenovic, N.; Alfsen, K.; Morlot, J. Corfee; de la Chesnaye, F.; Hourcade, J.-Ch.; Jiang, K.; Kainuma, M.; La Rovere, E.; Matysek, A.; Rana, A.; Riahi, K.; Richels, R.; Rose, S.; van Vuuren, D.; Warren, R., Issues related to mitigation in the long term context (PDF), archived (PDF) from the original on 22 September 2018, retrieved 13 September 2009 in Rogner et al. (2007)
- ^ Arrhenius, Svante (1896). "On the influence of carbonic acid in the air upon the temperature of the ground" (PDF). The London, Edinburgh, and Dublin Philosophical Magazine and Journal of Science. 41 (251): 237–276. doi:10.1080/14786449608620846. Archived (PDF) from the original on 18 November 2020. Retrieved 1 December 2020.
- ^ Arrhenius, Svante (1897). "On the Influence of Carbonic Acid in the Air Upon the Temperature of the Ground". Publications of the Astronomical Society of the Pacific. 9 (54): 14. Bibcode:1897PASP....9...14A. doi:10.1086/121158.
- ^ Cook, J.; Nuccitelli, D.; Green, S.A.; Richardson, M.; Winkler, B.R.; Painting, R.; Way, R.; Jacobs, P.; Skuce, A. (2013). "Quantifying the consensus on anthropogenic global warming in the scientific literature". Environmental Research Letters. 8 (2): 024024. Bibcode:2013ERL.....8b4024C. doi:10.1088/1748-9326/8/2/024024.


.png "refer to caption and adjacent text")
 hanerozoic Carbon Dioxide.png