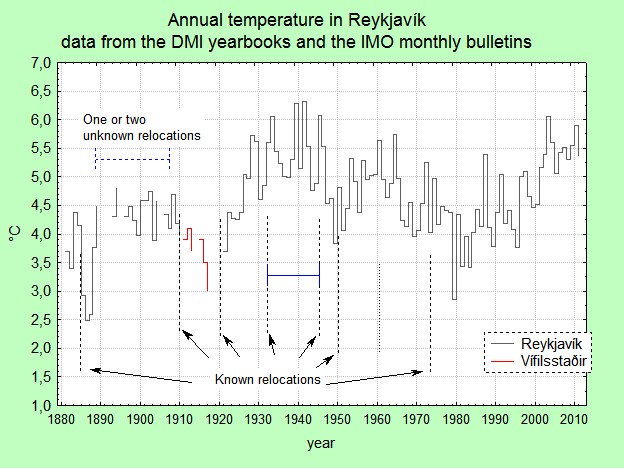
GISS' Updates to Analysis. There is no mention of Reykjavik here, but there are mentions of errors as large or larger than the Reykjavik correction and the dates on your plots would indicate that the adjustment was made shortly after GISS shifted from GHCN 2.4 to GHCN 3.2
GISS Surface Temperature Analysis
Updates to Analysis
Note 1: This webpage describes updates to the GISS analysis made in December 2011 and after, starting with the change to use of GHCN v3 data. Updates made before December 2011 are
detailed elsewhere.
Note 2: In spring 2015, NOAA's NCDC (mentioned in various entries below) was merged into NOAA's NCEI (National Center for Environmental Information), a new entity combining the three centers: NCDC, NGDC, and NODC (National Climate, Geophysical, and Oceanographic Data Center).
Graphs and tables are updated around the middle of every month using the current data files of NOAA GHCN v3 (meteorological stations), ERSST (ocean areas), and SCAR (Antarctic stations) combined as described in our December 2010 publication (Hansen et al. 2010). These updated files incorporate reports for the previous month and late reports and corrections for earlier months. Here we list updates of the data or procedures that have occurred since our 2010 publication (
Hansen et al. 2010).
July 19, 2015: The data and results put on the public site on July 15 were affected by a bug in the ERSST v4 part of the automated incremental update procedure. The analysis was redone after recreating the full version of SBBX.ERSSTv4 separately. We would like to acknowledge and thank Nick Stokes for noticing that there might be a problem with these data.
July 15, 2015: Starting with today's update, the standard GISS analysis is no longer based on ERSST v3b but on the newer ERSST v4. Dr. Makiko Sato created some
graphs and maps showing the effect of that change. More information may be obtained from
NOAA's website. Furthermore, we eliminated GHCN's Amundsen-Scott temperature series using just the SCAR reports for the South Pole.
June 13, 2015: NOAA's NCEI (formerly NCDC) switched from v3.2.2 to the new release v3.3.0 of the adjusted GHCN, which is our basic source. This upgrade included filling some gaps in a few station records and fixing some small bugs in the homogenization procedure. NCEI's description of those changes is available
here. One of the impacts was removing some data that the GISS procedure had always eliminated and the
list of GISS corrections was correspondingly reduced. Hence the (insignificant) impact on the GISS analysis was slightly different from the impact described in that document. The changes produced a decrease of 0.006°C/decade for the 1880 to 2014 trend of the annual mean
land surface air temperature rather than the 0.003°C/decade increase reported by NCEI. Both are substantially less than the margin of error for that quantity (±0.016°C/decade). Impacts on the changes of the annual Land-Ocean temperature index (global surface air temperature) were about 5 to 10 times smaller than the margin of error for those estimates.
Please note that neither the land data nor the ocean data used in this analysis are the ones used in the NCEI paper
"Possible artifacts of data biases in the recent global surface warming hiatus" that appeared on June 4, 2015. For the ocean data, GISS still uses ERSST v3b rather than the newer ERSST v4, but will switch to that file next month, when we add the June 2015 data; the collection of land station data used in that paper includes many more sources than GHCN v3.3.0 and will probably be incorporated into a future GHCN v4.
May 15, 2015: Due to an oversight several Antarctic stations were excluded from the analysis on May 13, 2015. The analysis was repeated today after including those stations.
February 14, 2015: UK Press reports in January 2015 erroneously claimed that differences between the raw GHCNv2 station data
(archived here) and the current final GISTEMP adjusted data were due to unjustified positive adjustments made in the GISTEMP analysis. Rather, these differences are dominated by the inclusion of appropriate homogeneity corrections for non-climatic discontinuities made in GHCN v3.2 in 2011/2012. See the earlier notes from December 14, 2011 and September 26, 2012; more details are provided in
FAQ.
December 29, 2014: The title on the US temperature graph was corrected by replacing "Continental US" by "Contiguous US". References to the corresponding graphs in the literature were updated.
September 15, 2014: Color maps using the Robinson projection or polar projection are now presented without contour smoothing, since that process occasionally results in skipping some color bands. It seems however to work fine for the equirectangular projection.
July 14, 2014: The missing China May 2014 reports became available and are now part of our analysis. That correction increased the global May 2014 anomaly by a statistically insignificant 0.002°C.
June 17, 2014: Analysis was delayed hoping the missing reports from China would become available. Unfortunately, this has not been the case yet. Please note, that the current May 2014 data are therefore not directly comparable to previous records.
Febuary 14, 2014: Two January 2014 reports from Greenland (Godthab Nuuk and Angmagssalik) and one from Mongolia (Dauunmod) were disregarded since they seemed unusual and proved to be inconsistent with other reports.
January 21, 2014: The GISS analysis was repeated this morning based on today's status of the GHCN data. The changes were well within the margin of error, e.g. the L-OTI mean for 2013 changed from 0.6048±0.02°C to 0.6065±0.02°C, a change of less than 0.002°C. However, rounding to 2 digits for the L-OTI table changed the 0.60°C used in some documents prepared last week to 0.61°C. This minuscule change also moved year 2013 from a tie for the 7th place to a tie for the 6th place in the GISS ranking of warmest years, demonstrating how non-robust these rankings are.
January 21, 2014: The GISTEMP
maps webpage now defaults to using the Robinson map projection. The previous default "regular" projection is labeled as Equirectangular.
August 14, 2013: The July 2013 report from Jaskul (46.2N, 45.4E) is inconsistent with its June 2013 report unlike the reports from neighboring stations. In that region, the July mean has been consistently higher than the June mean and not 4.3°C colder as the current report would indicate. Hence that report was not used in our analysis.
May 24, 2013: The
time series and
seasonal cycle website plotting tools were restored, which completes the return of the interactive features disabled in January. A problem with porting graphics software between servers led to a longer delay than expected.
May 15, 2013: The 3/3013 report from Dushanbe was corrected and the 3/3013 report from Kuwait was deleted in GHCN v3, so that these two GISS deletions were dropped.
April 15, 2013: Two March 2013 reports, one from Kuwait International Airport and one from Dushanbe (38.5N, 68.8E), did not agree with neighboring reports or with Weather Underground data. Hence they were not used in our analysis. The faulty February 2013 report from Nema was replaced by a corrected report in GHCN v3.
April 1, 2013: A comparison of our global analysis using NOAA ERSST (our current approach) for ocean temperature as opposed to NOAA OISST concatenated with HadSST1 is available on
Dr. Sato's webpage.
March 21, 2013: This update was delayed by an investigation of some unrealistic looking reports from various stations in Mongolia. NCDC eliminated the reports today. In addition, the February 2013 report from Nema also seems unrealistic and has been eliminated. Finally, from now on we will incorporate into our analysis the
reconstructed Byrd station data provided by Prof. David Bromwich.
February 24, 2013: The GISTEMP
maps and
station data website plotting tools were restored.
January 16, 2013: Starting with the January 2013 update,
NCDC's ERSST v3b data will be used to estimate the surface air temperature anomalies over the ocean instead of a combination of Reynold's OISST (1982 to present) and data obtained from the Hadley Center (1880-1981).
January 14, 2013: Due to technical problems with the webserver onto which the GISTEMP webpages were recently migrated, interactive plotting tools such as making maps of the surface temperature anomaly and line plots of station data were disabled as the site was migrated onto newer hardware.
November 19, 2012: The machine which hosted the GISTEMP web pages will be decommissioned shortly, and all files and utilities have been moved to a new server. As the new machine uses a different architecture and OS, many utilities required some adjustment. Please send email to
reto.a.ruedy@nasa.gov if you notice any problems.
September 26, 2012: NOAA/NCDC replaced GHCN v3.1 by GHCN v3.2. Hence the GISS analysis is based on that product starting 9/14/2012. Version v3.2 differs from v3.1 by minor changes in the homogenization of the unadjusted data. A description of the modifications in the adjustment scheme and their effects are available
here.
February 17, 2012: The analysis was redone on Feb 17 after learning from NOAA/NCDC that the operational version of GHCN v3 was only made available that afternoon.
February 12, 2012: The reported December 2011 data for the stations LIEPAJA, ALEKSANDROVSK, and ST.PETERSBURG were replaced by corrected reports and the strange Dec 1991 report from MALAKAL is no longer part of the adjusted GHCN v3. The corresponding entries in the
GISS list of suspicious data were removed.
January 18, 2012: The reported December 2011 data for the stations LIEPAJA, ALEKSANDROVSK, and ST.PETERSBURG were clearly incorrect and were discarded. Also, a likely artificial discontinuity for the station record of SHIQUANHE was eliminated by disregarding the data for 2005-present.
December 14, 2011: GHCN v2 and USHCN data were replaced by the adjusted GHCN v3 data. This simplified the combination procedure since some steps became redundant (combining different station records for the same location, adjusting for the station move in the St. Helena record, etc). See
related figures.