An additional, solid regression analysis, is based on this data
Which yields
"I used Microsoft Excel to run the regression. The data points covered the period from 1880 to 2007 inclusive, so there were N = 128 data points. The regression line I found was:
Anom = -1876.715416 * + 325.8718284 ln CO2
The numbers in parentheses are "t-statistics," and they measure how significant the numbers above them are. The coefficient of the CO2 term is significant at p < 2.4483 x 10-41. That means the chances against the relationship being coincidental are less than 1 in about 4 x 1040.
The correlation coefficient is about 0.874, which means 76.4% of the variance is accounted for. Every other factor that affected temperature during this time span, then, accounted for 23.6%."
Now here we have a nice ln fit of
"Anom = -1876.715416 * + 325.8718284 ln CO2" where CO2 is ranging from 290.7 to 383.6. *lnCO2 ranges from 5.6723 to 5.9495.
Temp is in hundreds of a degree and CO2 in ppm. "ln CO2 is the natural logarithm of the CO2 level. Radiation physics says the radiative forcing from accumulated carbon dioxide should be related to the log of the level rather than the level itself, so this is what we actually use in the computation."
The thing to do then, is to plot that regression result.
Here is the thing. *The ln function looks like this;
http://upload.wikimedia.org/wikipedia/commons/e/ea/Log.svg
Beyond x=2, the ln(x) is, for all practical purposes, linear. *And, it isn't asymptotic. *It does continue to increase without bound.
Over the range, as measured in the atmosphere, there is no significant difference between the linear and log response. Over that range,*from 290.7 to 383.6, the ln response is simply linear.
This is not uncommon. *In radio and television transmission, the power goes down at 1/r^2 in distance from the source. In the near field, near the transmitting antenna, the power is clearly not linear. *The far field is different because, at a distance from the source, 1/r^2 is linear, for all practical purposes. *The difference between 1/4 and 1/9 is noticable. *The difference between 1/10^2 and 1/11^2, not so much. *The difference between 1/100^2 and 1/101^2 is meaningless.
And over the range of CO2, from ln*290.7 to ln 383.6 is simply linear.
So that reconciles the linear vs log issue.
link ->
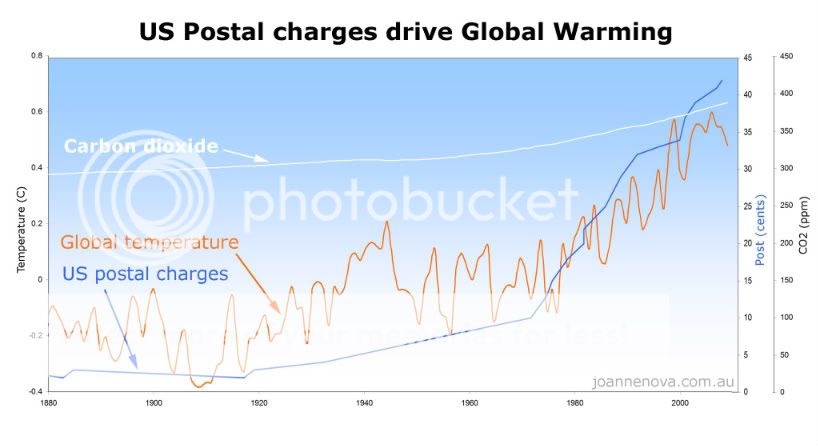
Temp v CO2 Correlation