Yes, yes, 95% of Climate scientist are getting it wrong, but you can read a graph, you think. Got it.
Those who are familiar with the science know that the total adjustments have, by making the past look much warmer, made the current warming look much smaller. That's not debatable, and that means Ian's crank conspiracy theory goes into the shitcan. Not that Ian will care. He's a true believer. His cult tells him to believe, so like every other denier here he'll keep cherrypicking his heart out until reality matches his dogma. He's not as dumb as the other deniers, but he is just as fanatical and brainwashed
The denier cult is based entirely on faking data. Fraud is what deniers do. It's all deniers do. If a denier says something, experience shows one should initially assume it's a lie, unless independent evidence indicates otherwise.
<data:blog.pageTitle/>
The thing you have to remember about mamooth is that he is a shyster. Three card monte, pea under the thimble, a huckster.
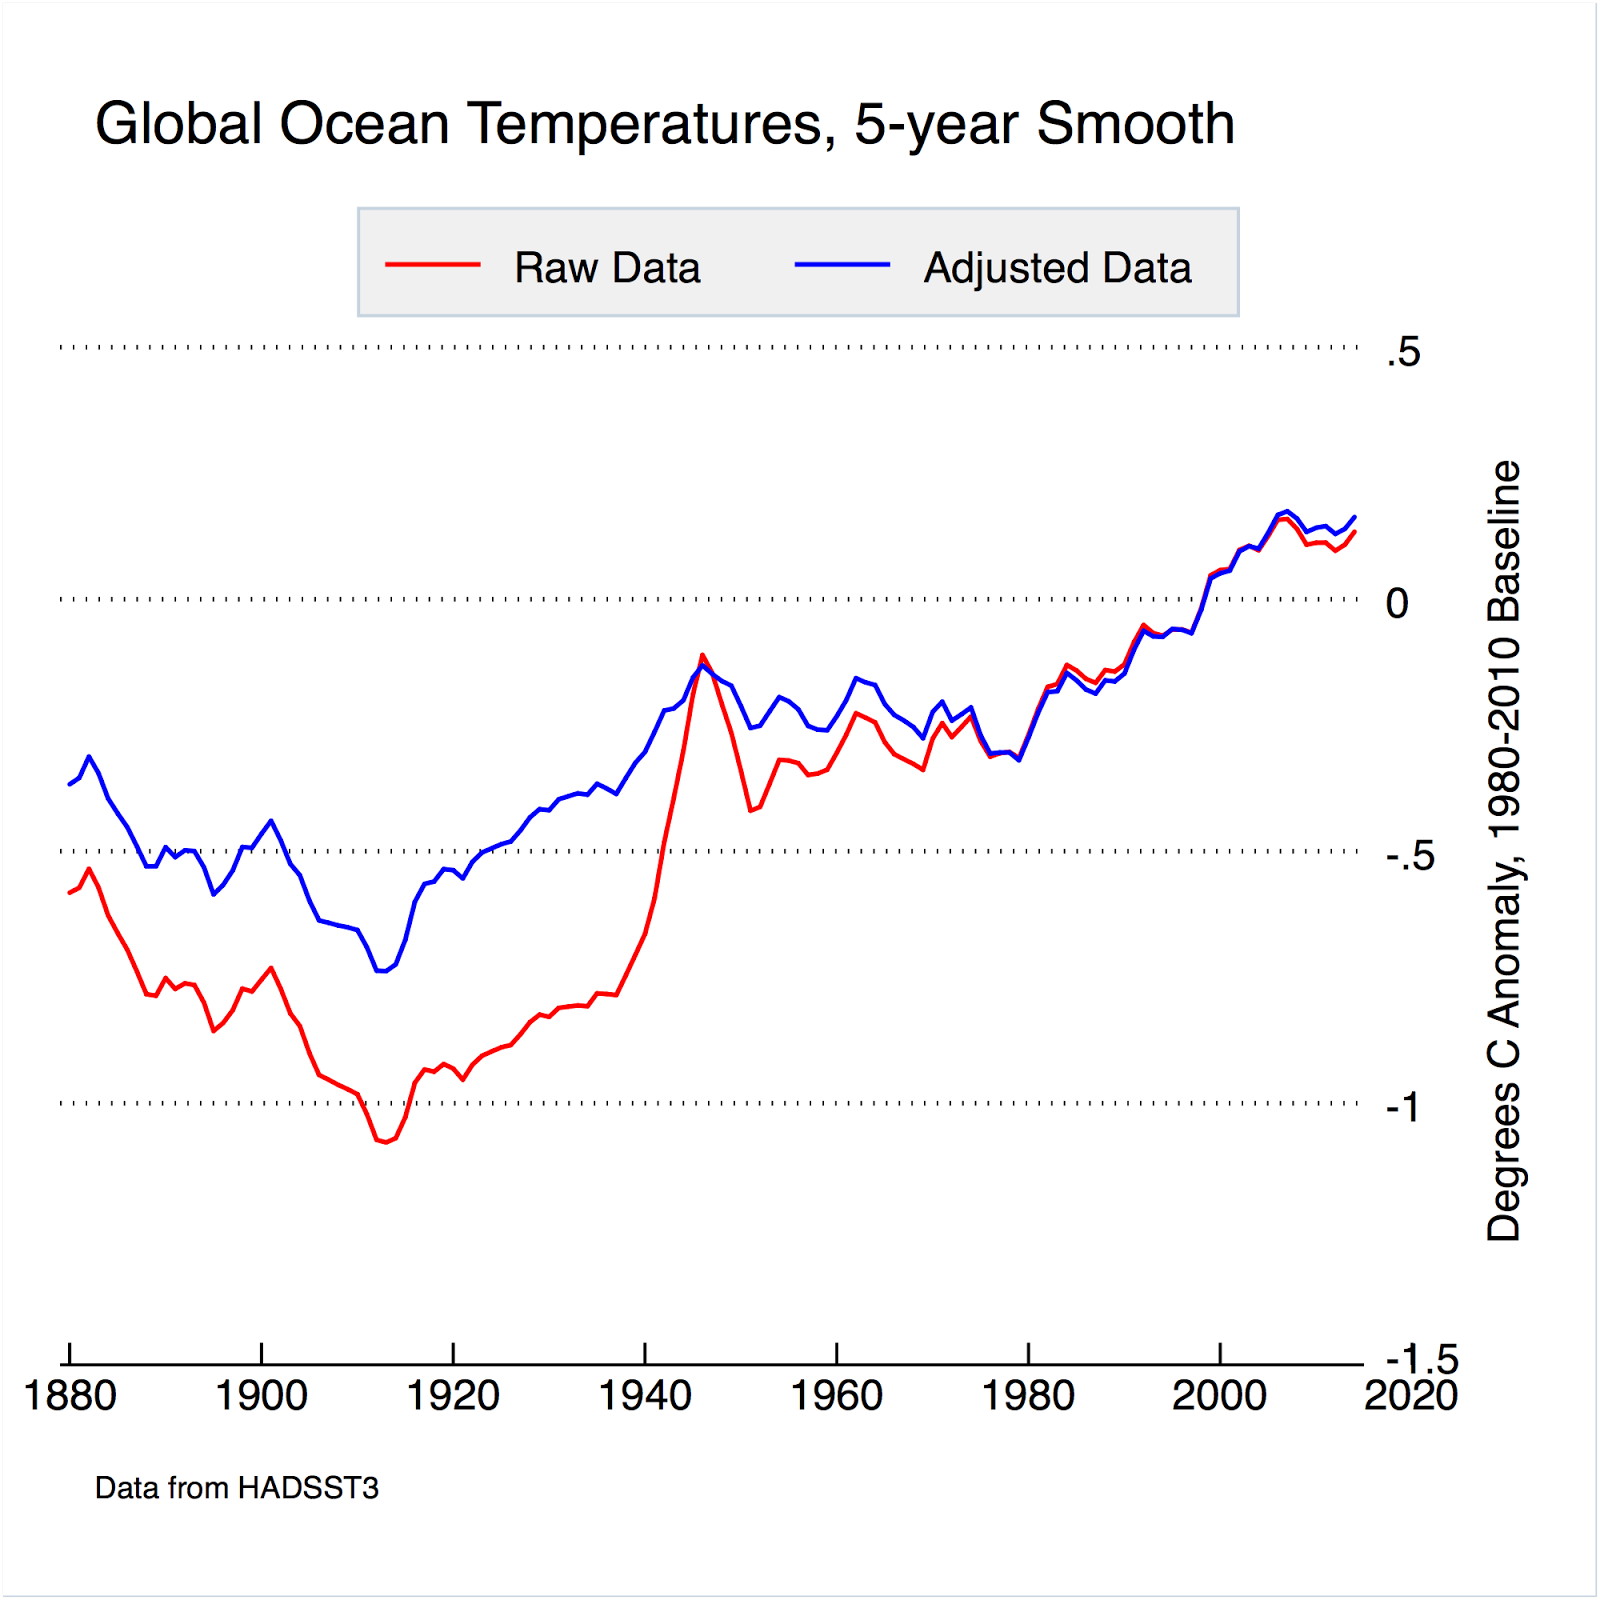
He tries to convince us that all adjustments are suitable because ONE large sea surface temperature correction went in the opposite direction. He wants us to ignore all the other adjustments since then.
In the 90s they just couldn't get the climate models to work with raw sea surface data so they made a large correction to compensate for going from canvas buckets to water intakes. A necessary but still discretionary adjustment.
Land surface station coverage is poor, especially before, say, 1950. But sea surface coverage is pathetic to non-existent for that period.
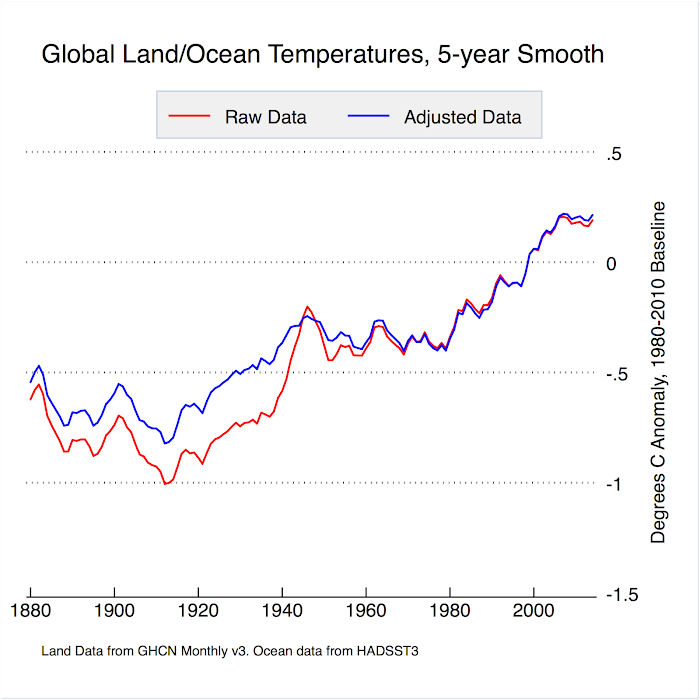
The poo flinging monkey likes to put up this graph as proof-
What does this graph imply? That post 1950 readings have hardly been adjusted, and that pre 1950 readings have been warmed. Say what????? That can't be right!
How the hell did they pull that off? Have you figured it out? Kept track of the pea under the thimble? Figured out which card is the queen of spades? Hahahaha.