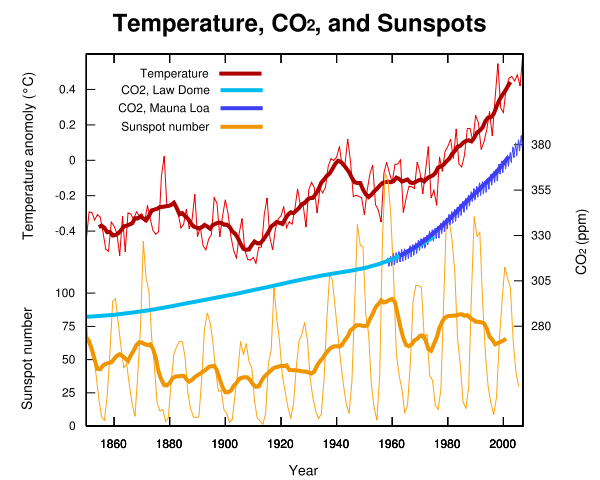
You really don't know much about radiation and heat do you. It takes longer to cool than to warm, thus if there isn't enough time between spikes the temperature will build up as will the radiation level. So the effects of this one fall are lost to the many spikes in solar flares (which is only one phenomena of stars in the first place), thus why the charts "mean" values are more important. The mean values have been at a high level for some time, since about the same time as the increase in our temperatures started. Thus by scientific logic the solar activity as a whole is more likely to be the cause in spite of any other phenomena. There have been many times when the CO2 and CO levels spiked due to volcanic activity both aquatic and dry land, but during those times the temperatures fell slightly globally, so the roll of CO2 is more likely reversed, an effect of the increased heat instead of the cause. However, the chart only shows a very tiny portion of data, not even enough to prove that solar activity isn't to blame, even though from just that small amount of data it is easy to see that there has to be a link. Environuts are just ignoring the possibility because they don't care about the survival of humans, they only care about crying wolf, which will result in the death of billions if the heating trend continues since it isn't likely an effect of pollution, by placing so much importance on trying to stop something that can't be stopped, we miss the chance to find a way to survive it. But meh, I don't really care if billions of humans die myself, even if I was included, no skin off my nose.