No, I'm not.
I never said word one about that.
No. That was the FIRST excuse. You're not following the story.
The ballot dump was the FIRST excuse, and it was IMMEDIATELY called out as a lie, by literally hundreds of people simultaneously all over the world
The lie was then retracted, and replaced with another lie. Which is the present topic of discussion.
lol
See, the great thing about probability is it doesn't matter what the reasons are. Fine, you say that's what it is, then fine, I believe you. I'll stipulate to it
The thing is - it doesn't change the outcome. The data is still the data. An election graph is kind of like looking at a stock ticker, it represents the combined activity of hundreds of individual transactions. One at a time, they cause upticks and downticks, the stock market types call that volatility. But taken together they have a well defined mean value, which is mostly what we see in the smoothness of the graphs like the one I posted. They are expected to be smooth "because of" the Law of Large Numbers. The generators aren't discontinuous - if they are, it's a "glitch", an anomaly
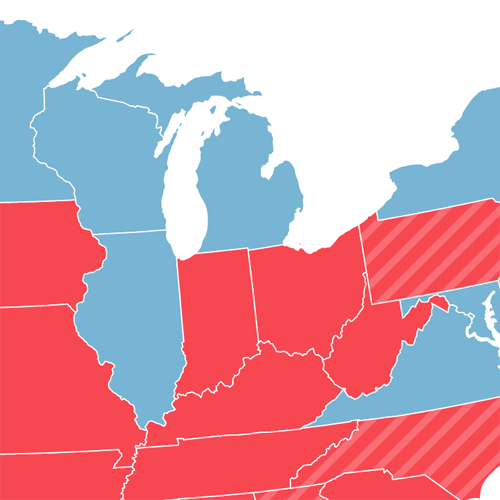
The first excuse, the ballot dump, can not possibly be true. It's mathematically impossible. Why? Look at the graph. It would mean Biden had to receive 100% of the votes in the ballot dump, which is entirely impossible.
24 hours later, the State of Michigan changed its story and said it was a counting error.
But guess what? The math says that's impossible too. I can explain in detail if you wish.