It's no secret that hack climate scientists who depend on federal sponsored global warming grants fudge data to keep the keep the money flowing . Temperature devices are placed on blacktop surfaces to obtain the maximum temperature extremes and ocean temperature statistics are taken in areas most likely to show typical extremes. We all should be aware that the gigantic nuclear reactor in the sky dictates climate fluctuations and sometimes Ice Age climate change. Is it possible that there are hidden statistics that indicate the short term and long term fluctuations of the Sun that "scientist" hacks ignore?
Navigation
Install the app
How to install the app on iOS
Follow along with the video below to see how to install our site as a web app on your home screen.

Note: This feature currently requires accessing the site using the built-in Safari browser.
More options
You are using an out of date browser. It may not display this or other websites correctly.
You should upgrade or use an alternative browser.
You should upgrade or use an alternative browser.
Do climate "scientists" measure the Sun's intensity
- Thread starter whitehall
- Start date
SSDD
Gold Member
- Nov 6, 2012
- 16,672
- 1,965
- 280
It seems that all they are interested in is TSI...the sun's output is far more complicated than that. The sun puts out a wide spectrum of energy and that spectrum varies wildly daily, monthly, yearly, and on longer scales. We have very little idea of how each wavelength of the solar spectrum acts on earth and how that may be far more potent in climate dynamics than we think at present.
It has been known for some years that the wavelengths that are primarily responsible for producing ozone vary wildly, as much as a factor of 10 every year, which in and of itself explains the yearly variations in the size of the ozone "hole"...but since there is no money to be made in natural variation, the ozone hole scam continues..
I doubt that there is much money to be made in demonstrating that various wavelengths, and their varying strength explains in large part, the changing climate...so till such time as there is money to be made in finding the truth, we will be left thinking that TSI is the end all and be all of the sun's effect on the climate..
Fort Fun Indiana
Diamond Member
- Mar 10, 2017
- 92,164
- 56,522
- 2,645
The fact that you came here for the answer, instead of looking up the methods of climate scientists, is a clear indicator that you are not honestly seeking the answer. Troll thread.It's no secret that hack climate scientists who depend on federal sponsored global warming grants fudge data to keep the keep the money flowing . Temperature devices are placed on blacktop surfaces to obtain the maximum temperature extremes and ocean temperature statistics are taken in areas most likely to show typical extremes. We all should be aware that the gigantic nuclear reactor in the sky dictates climate fluctuations and sometimes Ice Age climate change. Is it possible that there are hidden statistics that indicate the short term and long term fluctuations of the Sun that "scientist" hacks ignore?
Billy_Bob
Diamond Member
There are a few of us who are looking specifically at this. SHO is the federal operation where NOAA and others record the suns activities and strengths above our atmosphere.It's no secret that hack climate scientists who depend on federal sponsored global warming grants fudge data to keep the keep the money flowing . Temperature devices are placed on blacktop surfaces to obtain the maximum temperature extremes and ocean temperature statistics are taken in areas most likely to show typical extremes. We all should be aware that the gigantic nuclear reactor in the sky dictates climate fluctuations and sometimes Ice Age climate change. Is it possible that there are hidden statistics that indicate the short term and long term fluctuations of the Sun that "scientist" hacks ignore?
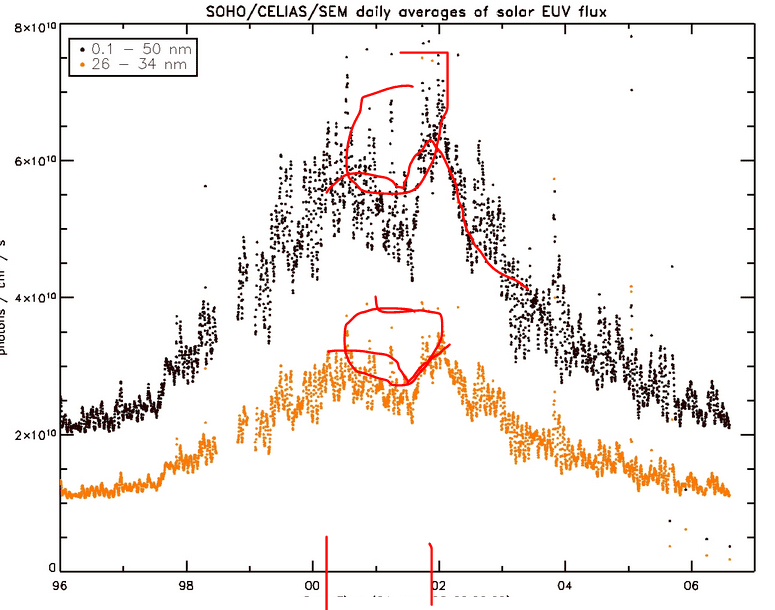
Late last year they documented a massive loss in radiative power from the sun in the 0.2-0.6um bands. This band is the band which penetrates our oceans to depths of 700 meters. The sun remains in this slump and is expected to continues for decades.
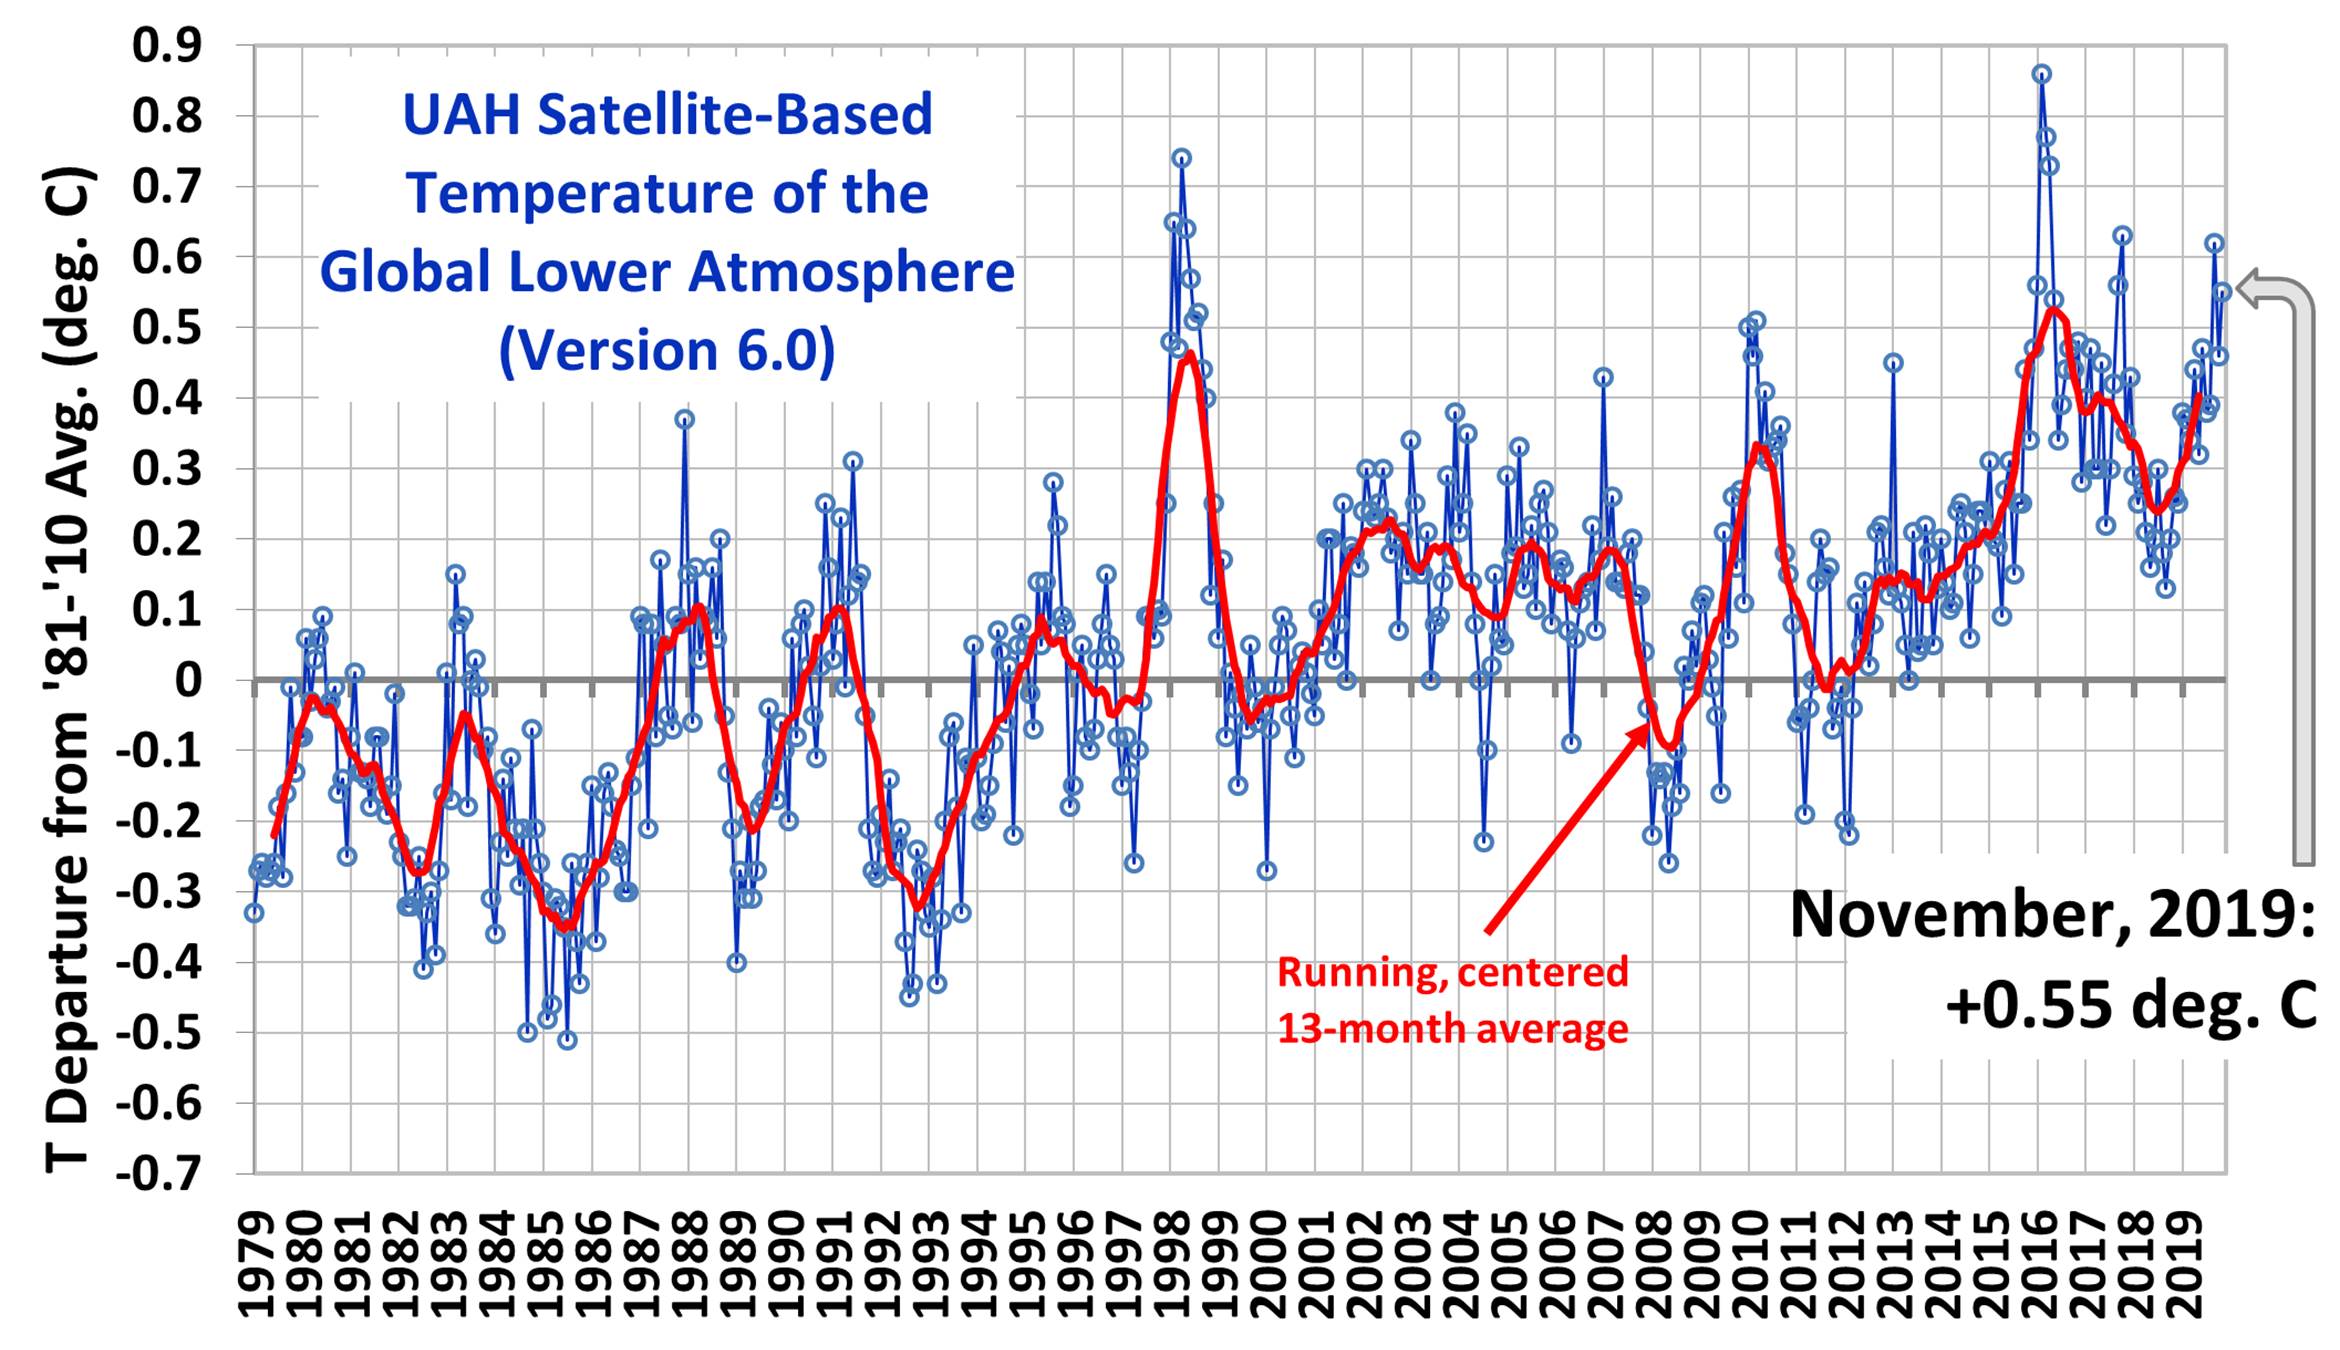
Things have been cooling now since 2012 and the loss in this band is at 27%. Well past the range where glaciation is likely to happen.
Last edited:
SSDD
Gold Member
- Nov 6, 2012
- 16,672
- 1,965
- 280
The fact that you came here for the answer, instead of looking up the methods of climate scientists, is a clear indicator that you are not honestly seeking the answer. Troll thread.It's no secret that hack climate scientists who depend on federal sponsored global warming grants fudge data to keep the keep the money flowing . Temperature devices are placed on blacktop surfaces to obtain the maximum temperature extremes and ocean temperature statistics are taken in areas most likely to show typical extremes. We all should be aware that the gigantic nuclear reactor in the sky dictates climate fluctuations and sometimes Ice Age climate change. Is it possible that there are hidden statistics that indicate the short term and long term fluctuations of the Sun that "scientist" hacks ignore?
By all means, lets see some of this science that you believe climatologists are doing. There seems to be a theme among you alarmists...you tell all sorts of stories about what you believe climate science to be doing..and all the empirical evidence that supports the beliefs you hold...but none of you seem to be able to produce any of this consensus science that you so fervently believe exists.
Us skeptics certainly don't have a problem laying our hands on actual published science that supports our position but you guys don't seem to have anything other than stories about the mythical science you believe exist....and are apparently not smart enough to wonder why our side routinely backs its position with actual science while your side has nothing but stories about science that you can't seem to produce...
Billy_Bob
Diamond Member
I recently posted this thread on this subject.
Solar Spectral Shift And Earths Atmospherics
For those who need a refresher..
Solar Spectral Shift And Earths Atmospherics
For those who need a refresher..
Billy_Bob
Diamond Member
Here is a post from my previous thread:

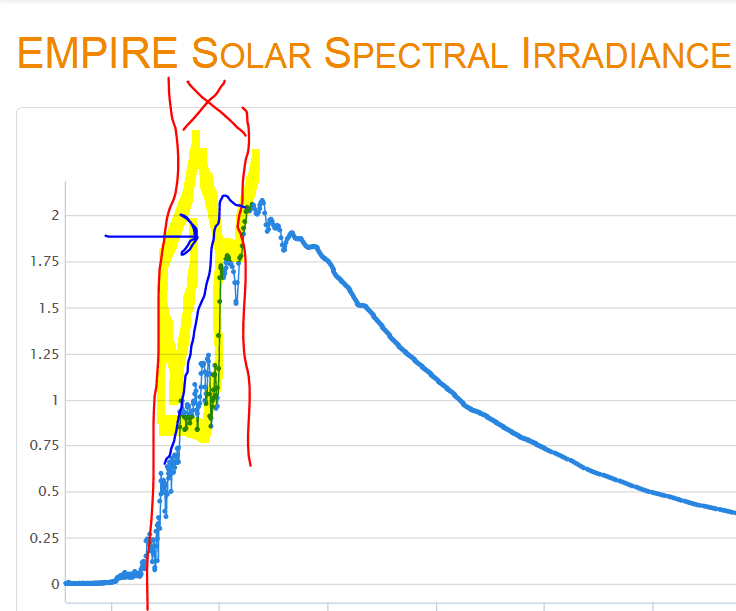
The dropout is massive from 0.2um to 1.8um. Over 11% drop in energy in this band. O3 should be reacting by dissipating because there is insufficient energy to create Ozone, at either pole. This also explains the cooling of equatorial oceans. There is simply a massive change in energy that can penetrate the ocean and warm it.
This dropout has been increasing for 3 years now. Definitely a cooling sun.
Solar Spectral Shift And Earths Atmospherics
Seen it a billion times in this forum.....the climate crusaders marginalize any impact the Sun may have on the climate.
Lol.....spoils the narrative.
Thankfully, voters are astute enough to recognize the sun is a big factor!!


Lol.....spoils the narrative.
Thankfully, voters are astute enough to recognize the sun is a big factor!!


Billy_Bob
Diamond Member
The red is the region of down-welling radiation that penetrates our oceans and warms them. Its bottoming out in relative terms. If this persists our oceans will cool rapidly. Talk about a major blow to our input energy..
The blue line I added above is average...
Below is the result of that energy loss.

The cooling shift has started and what is coming is going to rattle man to his core.
The ocean buffer is expended and cooling is now going to rule for a while. The loss were seeing today, when you do the math, is capable of -2.2 deg C globally inside 10 years. Hang on to your ass.
New ice age in the near future !
SSDD
Gold Member
- Nov 6, 2012
- 16,672
- 1,965
- 280

The red is the region of down-welling radiation that penetrates our oceans and warms them. Its bottoming out in relative terms. If this persists our oceans will cool rapidly. Talk about a major blow to our input energy..
The blue line I added above is average...
Below is the result of that energy loss.

The cooling shift has started and what is coming is going to rattle man to his core.
The ocean buffer is expended and cooling is now going to rule for a while. The loss were seeing today, when you do the math, is capable of -2.2 deg C globally inside 10 years. Hang on to your ass.
New ice age in the near future !
Sucks to be right about that sort of thing.....doesn't it?
Billy_Bob
Diamond Member
I just sent a letter over to SOHO to get a month by month graphing for the last 8 years. Once I get it compiled, I want to show cause and effect in our oceans, which generally lag by about 2 years from minor changes but less than a month on major ones. Our buffered climactic system is the only reason we are not in a glacial phase today.
The red is the region of down-welling radiation that penetrates our oceans and warms them. Its bottoming out in relative terms. If this persists our oceans will cool rapidly. Talk about a major blow to our input energy..
The blue line I added above is average...
Below is the result of that energy loss.

The cooling shift has started and what is coming is going to rattle man to his core.
The ocean buffer is expended and cooling is now going to rule for a while. The loss were seeing today, when you do the math, is capable of -2.2 deg C globally inside 10 years. Hang on to your ass.
New ice age in the near future !
Sucks to be right about that sort of thing.....doesn't it?
ReinyDays
Gold Member
... Late last year they documented a massive loss in radiative power from the sun in the 0.2-0.6um bands ...
That wavelength range is the upper half of visible light ... without blue, green or yellow light, the sun would be profoundly red ...
... The dropout is massive from 0.2um to 1.8um ...
This includes the entire visible spectrum ... the sun would mostly stop shining ...
Interesting `facts` there Billy-Bob ... total horseshit but still interesting ...
-----
Climatologists rely on solar astronomers for their input flux numbers ... and these numbers are variable and unpredictable ... but on average runs 1,361 W/m^2 as measured in space ... and climatology is all about averages, so that's a valid number to use in our energy budget calculations ... solar output is also cyclic, about 22 years peak-to-peak, and this is one of the more important reasons to use 100 year climate averages, this lets us average out the variabilities over four solar cycles ... any time period shorter risks individual solar cycles being stronger/weaker than average and corrupting our climate data ...
The sun also vomits out matter, not just energy ... the Earth is bombarded with bare naked protons all the time ... plus a wide variety on even nastier species ... almost all this is dealt with above 1mb elevation and doesn't really effect day-to-day weather, or the 100 year climate averages ... but occasionally it does ... we just don't know for sure ...
Sunsettommy
Diamond Member
- Mar 19, 2018
- 14,884
- 12,518
- 2,400
Oh look, Crepitus is lying again, claiming skeptics denies climate changes.
When are you going to stop ducking the debate and to stop lying?
Maybe this is really you?
miketx
Diamond Member
- Dec 25, 2015
- 121,556
- 70,505
- 2,645
- Banned
- #15
So show us all the "truth" then. lolThe fact that you came here for the answer, instead of looking up the methods of climate scientists, is a clear indicator that you are not honestly seeking the answer. Troll thread.It's no secret that hack climate scientists who depend on federal sponsored global warming grants fudge data to keep the keep the money flowing . Temperature devices are placed on blacktop surfaces to obtain the maximum temperature extremes and ocean temperature statistics are taken in areas most likely to show typical extremes. We all should be aware that the gigantic nuclear reactor in the sky dictates climate fluctuations and sometimes Ice Age climate change. Is it possible that there are hidden statistics that indicate the short term and long term fluctuations of the Sun that "scientist" hacks ignore?
Old Rocks
Diamond Member
Old Rocks
Diamond Member
Old Rocks
Diamond Member
ReinyDays
Gold Member
Just curious, how are they calculating the day's average before the day is done? ... I'm looking at this at 2300 GMT and you posted this at 1900 GMT ... wait wait wait, University of Maine, now it makes sense ...
Crepitus
Diamond Member
- Mar 28, 2018
- 71,858
- 59,192
- 3,615
Did you at least wash your hands before you posted that?
Oh look, Crepitus is lying again, claiming skeptics denies climate changes.
When are you going to stop ducking the debate and to stop lying?
Maybe this is really you?
View attachment 295064
Similar threads
- Replies
- 39
- Views
- 957
- Replies
- 17
- Views
- 462
- Replies
- 305
- Views
- 5K
Latest Discussions
- Replies
- 910
- Views
- 9K
- Replies
- 167
- Views
- 1K
- Replies
- 26
- Views
- 77
Forum List
-
-
-
-
-
Political Satire 8018
-
-
-
-
-
-
-
-
-
-
-
-
-
-
-
-
-
-
-
ObamaCare 781
-
-
-
-
-
-
-
-
-
-
-
Member Usernotes 467
-
-
-
-
-
-
-
-
-
-


