Currently oil prices are lower than almost any day from the end of 2004 through 2014. It’s also the same exact price as the average price in 2018. So, what exactly is the crisis?

 www.macrotrends.net
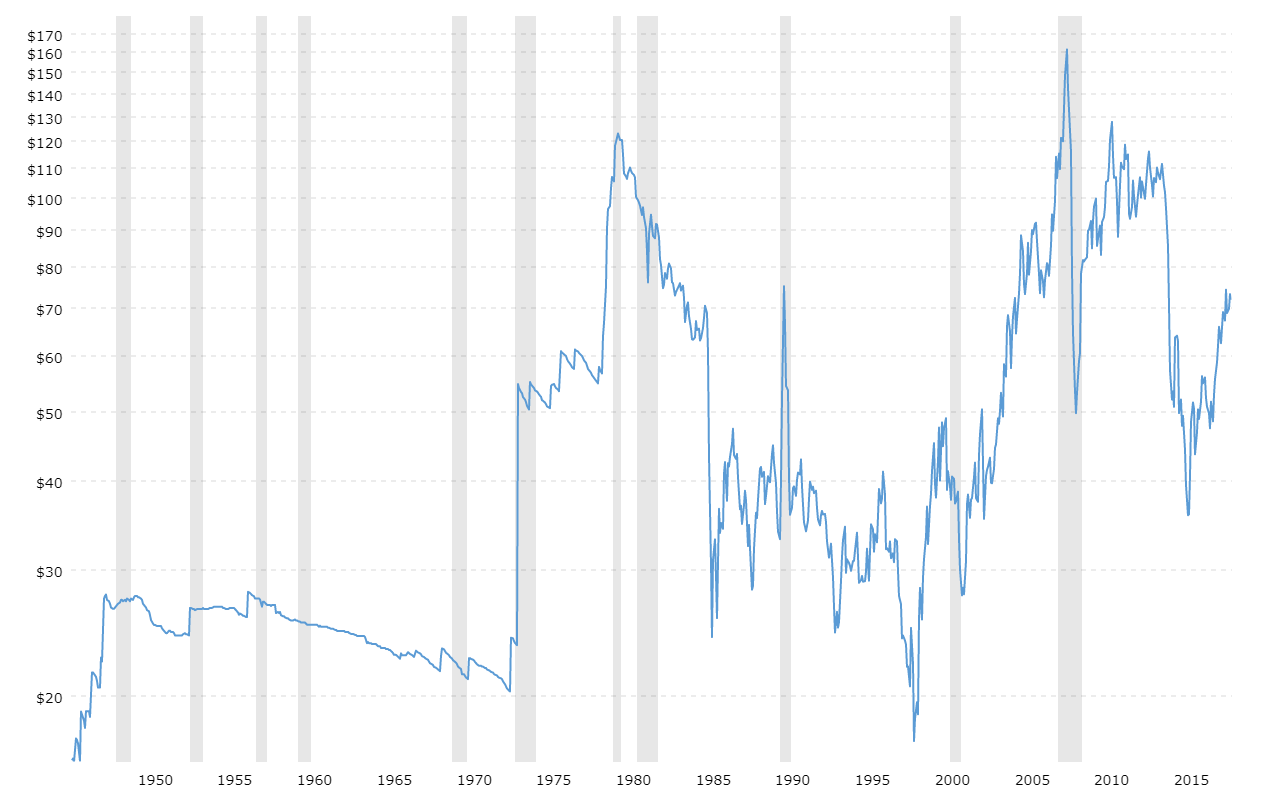
Crude Oil Prices - 70 Year Historical Chart
Interactive charts of West Texas Intermediate (WTI or NYMEX) crude oil prices per barrel back to 1946. The price of oil shown is adjusted for inflation using the headline CPI and is shown by default on a logarithmic scale. The current month is updated on an hourly basis with today's latest value.
