IDIOCRACY
Diamond Member
- Nov 16, 2017
- 4,946
- 5,353
- 1,938
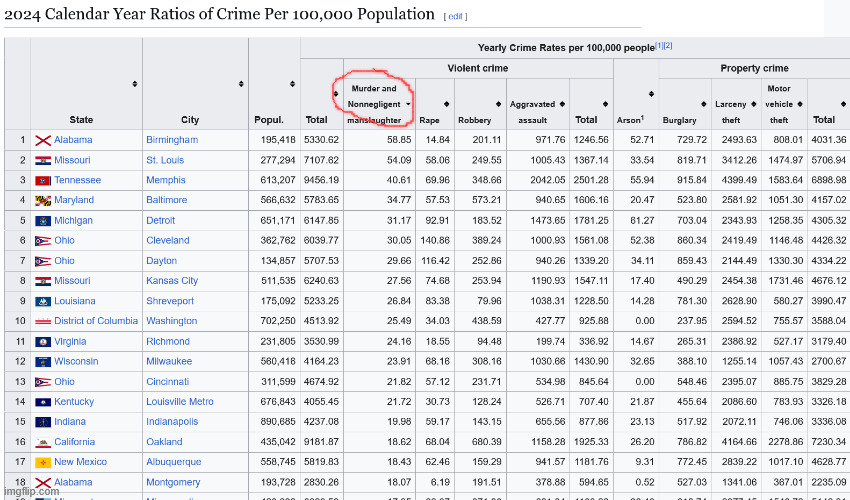
These are listed in order of US cities with the most crime. It is from the first full page, off here: List of United States cities by crime rate - Wikipedia
"Scholars love per capita. They would have you believe that golly, just because there are 1000 crime incidents downtown all day vs smaller numbers, it's a safer place, because the population is so many. Plus the info. is skewed for "State crime rates", and there are other things to consider, like liberal wealth, who control the beaches, and they control crime in their own neighborhoods real good, know what I mean? Their incidents of crime is perfect, just as they are, in a perfect world
This says a lot about the voters, as well as the govt. Of 116 cities with the most crime, 77 are Democrat, 18 are purple, and 21 are Republican. Party affiliation is provided by https://bestneighborhood.org. Link does you no good, Google search "(insert city) political map", they should be on the first page.
Tennessee Memphis 613,207 9456.19 2501.28 6898.98 Democrat
California Oakland 435,042 9181.87 1925.33 7230.34 Democrat
Missouri St. Louis 277,294 7107.62 1367.14 5706.94 Democrat
Arkansas Little Rock 204,247 6916.14 1672 5214.27 Democrat
Washington Tacoma 223,980 6715.33 1063.04 5603.63 Democrat
Minnesota Minneapolis 423,282 6329.59 1160.22 5142.91 Democrat
Oregon Portland 623,066 6288.1 720.15 5526.22 Democrat
Missouri Kansas City 511,535 6240.63 1547.11 4676.12 Democrat
Michigan Detroit 651,171 6147.85 1781.25 4305.32 Democrat
Utah Salt Lake City 212,675 6085.81 864.23 5199.95 Democrat
Ohio Cleveland 362,762 6039.77 1561.08 4426.32 Democrat
Colorado Lakewood 155,868 5899.86 787.2 5093.41 Democrat
New Mexico Albuquerque 558,745 5819.83 1181.76 4628.77 Democrat
Washington Seattle 760,058 5802.85 775.07 5007.64 Democrat
Maryland Baltimore 566,632 5783.65 1606.16 4157.02 Democrat
Colorado Denver 722,031 5773.02 993.03 4761.57 Democrat
Ohio Dayton 134,857 5707.53 1339.2 4334.22 Republican
Tennessee Nashville 698,987 5641.31 1124.06 4509.53 Democrat
Washington Spokane 229,529 5570.97 674.86 4840.78 Democrat
Pennsylvania Philadelphia 1,549,259 5503.53 908.69 4548.17 Democrat
Texas Houston 2,319,160 5451.46 1148.17 4293.45 Traditionally Democrat, recently swings right.
Missouri Springfield 170,527 5379.79 1178.11 4184.67 Republican
Alabama Birmingham 195,418 5330.62 1246.56 4031.36 Republican
Louisiana Shreveport 175,092 5233.25 1228.5 3990.47 Democrat
Texas San Antonio 1,514,458 5229.46 594.14 4623.63 Democrat
New York Syracuse 145,175 5014.64 765.28 4234.2 Democrat
Tennessee Chattanooga 188,894 4778.87 823.74 3942.42 Republican
Ohio Cincinnati 311,599 4674.92 845.64 3829.28 Republican
Kansas Kansas City 153,363 4655.62 1047.19 3606.48 Democrat
Oklahoma Tulsa 411,310 4582.43 941.87 3627.43 Republican
California San Francisco 802,856 4558.73 596.5 3929.1 Democrat
New York Buffalo 273,728 4549.04 706.18 3809.62 Democrat
District of Columbia Washington 702,250 4513.92 925.88 3588.04 Democrat
North Carolina Charlotte-Mecklenburg 1,003,130 4454.86 733.21 3705.3 Democrat
North Carolina Durham 300,208 4430.59 619.24 3799.7 Democrat
North Carolina Greensboro 304,306 4336.42 923.74 3383.11 Purple
Virginia Norfolk 230,460 4245.86 469.5 3772.46 Democrat
Indiana Indianapolis 890,685 4237.08 877.86 3336.08 Purple
North Dakota Fargo 135,682 4206.16 498.22 3696.88 Purple
Colorado Colorado Springs 491,474 4193.91 715.6 3448.81 Republican
California Long Beach 444,232 4185.88 676.45 3478.81 Democrat
Wisconsin Milwaukee 560,416 4164.23 1430.9 2700.67 Democrat
California Hayward 153,419 4155.94 477.12 3656.65 Democrat
Connecticut New Haven 137,243 4132.09 534.82 3587.07 Democrat
Colorado Aurora 397,852 4074.38 947.84 3103.92 Democrat
Kentucky Louisville Metro 676,843 4055.45 707.4 3326.18 Purple
California Fresno 546,722 4045.38 735.47 3271.32 Democrat, actually voted for Trump 2024
Illinois Chicago 2,638,698 4029.75 539.85 3472.39 Democrat
South Carolina Columbia 144,559 4021.89 769.93 3232.59 Purple
Texas Dallas 1,321,502 4021.33 658.19 3351.87 Republican
Washington Vancouver 198,194 4006.18 582.26 3407.27 Purple
New York Rochester 206,093 3923.96 582.26 3289.29 Democrat
Arizona Tucson 548,789 3921.91 588.75 3313.11 Democrat
Texas Corpus Christi 316,108 3895.19 863.63 3011.31 Purple
Iowa Des Moines 209,245 3845.73 703 3126.48 Purple
California Stockton 319,069 3836.16 1145.83 2639.55 Democrat
Ohio Toledo 263,668 3823.75 1041.08 2732.22 Democrat
California San Bernardino 224,283 3817.94 897.08 2897.68 Democrat
Alaska Anchorage 286,958 3811.01 1014.78 2765.91 Purple
Ohio Akron 188,223 3797.09 820.3 2955.01 Purple
North Carolina Fayetteville 209,945 3781.47 660.17 3094.62 Democrat
North Carolina Winston-Salem 254,041 3758.45 809.71 2921.18 Republican -slightly
Massachusetts Springfield 155,491 3755.84 891.37 2835.53 Democrat
Texas Austin 984,613 3724.1 466.88 3241.88 Democrat - slightly
Oregon Eugene 178,057 3642.09 317.88 3255.7 Democrat
Illinois Rockford 145,280 3627.48 1079.98 2517.21 Democrat - slightly
Oklahoma Oklahoma City 709,456 3586.41 676.01 2893.48 Republican
Nebraska Omaha 480,235 3549.1 368.99 3161.79 Republican -slightly
Virginia Richmond 231,805 3530.99 336.92 3179.4 Democrat - slightly
Minnesota St. Paul 304,051 3506.32 617.66 2834.06 Democrat
California Pomona 143,726 3488.58 715.95 2753.16 Democrat
Washington Bellevue 151,520 3486.67 138.6 3339.49 Democrat
Texas Mesquite 148,803 3483.13 501.33 2976.42 Democrat
Florida3 Miami 460,392 3478.34 473.29 2995.06 Democrat, actually voted for Trump 2024
Texas Lubbock 269,900 3473.14 821.04 2628.75 Republican
Tennessee Knoxville 200,457 3466.08 740.31 2721.28 Republican
South Dakota Sioux Falls 210,926 3453.82 526.73 2915.24 Republican -slightly
California Riverside 320,148 3450.9 589.73 2832.13 Democrat - slightly
Florida3 Gainesville 147,022 3450.5 737.98 2703.68 Democrat
Michigan Grand Rapids 195,913 3416.31 910.1 2480.69 Republican -slightly
Oregon Salem 177,936 3397.29 532.21 2803.26 Purple
Texas Amarillo 203,039 3374.72 690.51 2655.65 Republican
Arizona Tempe 191,376 3371.37 470.28 2893.78 Purple
New Jersey Paterson 158,903 3338.51 978.58 2351.12 Democrat
California Sacramento 526,670 3331.69 754.93 2547.33 Democrat
North Carolina Raleigh 488,085 3315.41 488.85 2819.18 Democrat - slightly
California San Jose 956,840 3210.05 606.79 2587.89 Democrat
California Victorville 140,309 3192.24 1015.62 2128.87 Purple
Virginia Newport News 183,563 3173.3 735.99 2416.06 Democrat - slightly
Texas Fort Worth 997,476 3171.2 458.36 2699.81 Republican -slightly
Arizona Glendale 255,512 3170.89 488.43 2670.72 Purple
Virginia Hampton 138,100 3139.75 247.65 2881.97 Democrat
Arizona Phoenix 1,662,809 3138.54 799.61 2325.34 Republican -slightly
Colorado Thornton 145,847 3129.31 273.57 2835.85 Democrat
California Modesto 218,990 3128 655.74 2414.72 Democrat - slightly
California Torrance 136,899 3095.71 311.18 2775.77 Democrat
Ohio Columbus 915,447 3090.08 434.87 2653.35 Democrat - slightly
Florida3 St. Petersburg 264,999 3083.03 619.62 2458.88 Democrat - slightly
New Jersey Elizabeth 138,500 3069.31 408.66 2657.76 Democrat
Nevada Las Vegas 1,716,565 3063.97 429.81 2622.74 Democrat
New York New York 8,299,271 3049.24 671.02 2368.27 Democrat
California Bakersfield 416,120 3028.45 554.65 2469.72 Purple
Nevada Reno 278,313 2979.38 529.62 2445.09 Purple
Iowa Cedar Rapids 135,363 2957.23 261.52 2689.07 Democrat - slightly
Texas Pasadena 145,199 2927.02 566.12 2351.94 Democrat - slightly
Texas Arlington 399,840 2898.16 482.94 2412.72 Republican -slightly
Alabama Huntsville 228,697 2878.92 483.17 2388.31 Republican -slightly
Virginia Alexandria 155,153 2861.69 219.14 2639.97 Democrat
Kansas Wichita 395,486 2861.29 538.58 2302.99 Republican
Georgia Columbus 201,061 2842.42 603.8 2235.64 Democrat
Alabama Montgomery 193,728 2830.26 594.65 2235.09 Democrat
Nebraska Lincoln 295,808 2817.37 347.86 2445.84 Purple
California Lancaster 164,012 2787.6 834.7 1920.59 Democrat
California Anaheim 338,488 2743.67 596.18 2132.13 Democrat
Pennsylvania Pittsburgh 317,177 2730.02 427.21 2280.11 Purple
Massachusetts Boston 659,049 2652.61 627.87 2021.7 Democrat
Last edited: