As one can see from the graph, we started, in 1979, with a winter area of 15 million kilometers, and a summer area of 5.5 million kilometers. This years winter high was 13 million kilometers, and the last four years lows have been from 3 to 3.5 million kilometers. That is about a 50% reduction for the summer low.
http://arctic.atmos.uiuc.edu/cryosphere/IMAGES/seaice.area.arctic.png
For the volume, the reduction is even more significant.
Polar Science Center » Arctic Sea Ice Volume Anomaly, version 2
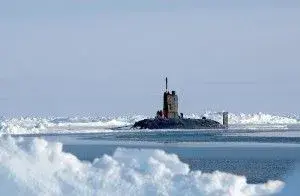
I wonder what the sea ice coverage was in the 1960's when submarines surfaced in open water at the North Pole?
Easy enough to check, Walleyes.
Trends and variability in summer sea ice cover in the Canadian Arctic based on the Canadian Ice Service Digital Archive, 1960–2008 and 1968–2008
Trends and variability in summer sea ice cover in the Canadian Arctic based on the Canadian Ice Service Digital Archive, 19602008 and 19682008
Trends and variability in summer sea ice cover in the Canadian Arctic based on the Canadian Ice Service Digital Archive, 19602008 and 19682008
Adrienne Tivy
Foothills Climate Analysis Facility, Centre for Alpine and Arctic Climate Research, Department of Geography, University of Calgary, Calgary, Alberta, Canada
Stephen E. L. Howell
Climate Processes Section, Climate Research Division, Atmospheric Science and Technology Directorate, Environment Canada, Toronto, Ontario, Canada
Bea Alt
Balanced Environmental Associates, Carlsbad Springs, Ontario, Canada
Steve McCourt
Canadian Ice Service, Meteorological Service of Canada, Environment Canada, Ottawa, Ontario, Canada
Richard Chagnon
Canadian Ice Service, Meteorological Service of Canada, Environment Canada, Ottawa, Ontario, Canada
Greg Crocker
Ballicator Consulting Ltd., Kingston, Ontario, Canada
Tom Carrieres
Canadian Ice Service, Meteorological Service of Canada, Environment Canada, Ottawa, Ontario, Canada
John J. Yackel
Foothills Climate Analysis Facility, Centre for Alpine and Arctic Climate Research, Department of Geography, University of Calgary, Calgary, Alberta, Canada
The Canadian Ice Service Digital Archive (CISDA) is a compilation of weekly ice charts covering Canadian waters from the early 1960s to present. The main sources of uncertainty in the database are reviewed and the data are validated for use in climate studies before trends and variability in summer averaged sea ice cover are investigated. These data revealed that between 1968 and 2008, summer sea ice cover has decreased by 11.3% ± 2.6% decade−1 in Hudson Bay, 2.9% ± 1.2% decade−1 in the Canadian Arctic Archipelago (CAA), 8.9% ± 3.1% decade−1 in Baffin Bay, and 5.2% ± 2.4% decade−1 in the Beaufort Sea with no significant reductions in multiyear ice. Reductions in sea ice cover are linked to increases in early summer surface air temperature (SAT); significant increases in SAT were observed in every season and they are consistently greater than the pan-Arctic change by up to ∼0.2°C decade−1. Within the CAA and Baffin Bay, the El Niño-Southern Oscillation index correlates well with multiyear ice coverage (positive) and first-year ice coverage (negative) suggesting that El Niño episodes precede summers with more multiyear ice and less first-year ice. Extending the trend calculations back to 1960 along the major shipping routes revealed significant decreases in summer sea ice coverage ranging between 11% and 15% decade−1 along the route through Hudson Bay and 6% and 10% decade−1 along the southern route of the Northwest Passage, the latter is linked to increases in SAT. Between 1960 and 2008, no significant trends were found along the northern western Parry Channel route of the Northwest Passage