lol, what do you believe AGT represents?The current AGT is not 1C. It is around 15C.Sure we can. We are still below the peak temperature of the past four interglacial cycles. Use your eyes. Besides isn't the current AGT 1C? Can you see on this graph where it shows the AGT temperature at 0 time (i.e. the present) to be 1C?
Navigation
Install the app
How to install the app on iOS
Follow along with the video below to see how to install our site as a web app on your home screen.
Note: This feature may not be available in some browsers.
More options
Style variation
You are using an out of date browser. It may not display this or other websites correctly.
You should upgrade or use an alternative browser.
You should upgrade or use an alternative browser.
Arctic heat
- Thread starter Old Rocks
- Start date
Wuwei
Gold Member
- Apr 18, 2015
- 5,342
- 1,178
- 255
Average global temperature.lol, what do you believe AGT represents?
What do you think it represents?
lol, and what is the reference point for AGT?Average global temperature.lol, what do you believe AGT represents?
What do you think it represents?
Wuwei
Gold Member
- Apr 18, 2015
- 5,342
- 1,178
- 255
The Celsius scale. It is defined by ice at 0C, and the boiling point of water at 100C.lol, and what is the reference point for AGT?
flacaltenn
Diamond Member
The Celsius scale. It is defined by ice at 0C, and the boiling point of water at 100C.lol, and what is the reference point for AGT?
Except that AGT is hardly ever mentioned. The whole metrics for GW is based on "normalized" GMAST. And usually, the GMAST baseline is much shorter than anything that should be used for climate change. EVEN if -- it becomes a century average and not just a 30 year running average.
Wuwei
Gold Member
- Apr 18, 2015
- 5,342
- 1,178
- 255
The NASA graph of more recent temperatures that Ding was concerned with looks like a 100 year average. Ding referred to it as a GMT so I went with that. It seems that the GMAST is a (slowly) moving target, and the GMT is a faster moving target. Thanx for the info.
Don't be stupid, that is the unit of measure not the reference point.The Celsius scale. It is defined by ice at 0C, and the boiling point of water at 100C.lol, and what is the reference point for AGT?
The reference point is a temperature from a specific year. The AGT is a delta temperature from the reference temperature. Which is why I spewed coke all over my keyboard wen you stated that the AGT was 15C. It appears from post #200 that you believe the current average global temperature is 15C.
What do you do for a living exactly?
Old Rocks
Diamond Member
- Thread starter
- #208
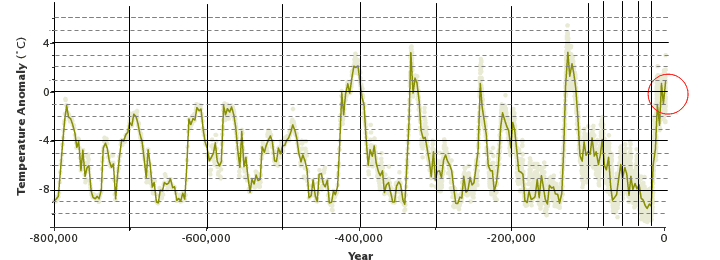
No. The slopes are not very different. Use your eyes. But even if they were, that doesn't mean diddly squat. The reality is that we are still below the peak temperatures of the last 4 interglacial cycles. What part of this do you not understand?LOL Goddamn! Engineer, eh? Lordy, lordy. The slopes of the lines are very different on a graph with the same scales for time and temperature. That you cannot grasp that puts a lie to your claim to be an engineer.Sure. By inspection I don't see any difference either.It doesn't matter what the graphs represent. The slopes are still easily calculable from the data that they do show.It's not that they can't. It is that the data from past climates does not have the resolution to do so. They can't tell you what it was from year to year or even decade to decade with any precision.
[/QUOTE]
Good God, again, you claim to be an engineer?

In the upper graph, on the Y axis, the distance for ten degrees is the same as the distance for one degree on the bottom graph. On the X axis, the distance on the upper graph for 200,000 years is only about 700 years on the bottom graph. So the slopes are very different if you put them on the same scales. It took, on the upper graph, a minimum of ten thousand years to warm from the bottom of the glacial, to the maximum warmth of the interglacial. That is less than a degree every thousand years.
So, on the bottom graph, put a dot at -1 degrees at 500. Now put a dot at 0 degrees at 1500. Draw a line between them. That is your slope for the glacial to interglacial warmup. Now look at that slope on the last 150 years. That is a fairly accurate comparison of the two slopes. Dingleberry, you are rapidly demonstrating that you intellect is in the same class as SSDD and Frankie boi.
Old Rocks
Diamond Member
- Thread starter
- #209
Well, I would guess that he failed to put the decimal point in. As for what he does for a living, which McD's do you flip burgers for? No engineer would make that mistake of stating that the slopes on the two graphs you repeatedly post are the same.Don't be stupid, that is the unit of measure not the reference point.The Celsius scale. It is defined by ice at 0C, and the boiling point of water at 100C.lol, and what is the reference point for AGT?
The reference point is a temperature from a specific year. The AGT is a delta temperature from the reference temperature. Which is why I spewed coke all over my keyboard wen you stated that the AGT was 15C. It appears from post #200 that you believe the current average global temperature is 15C.
What do you do for a living exactly?
Wuwei
Gold Member
- Apr 18, 2015
- 5,342
- 1,178
- 255
I was referring to the yearly global average temperature. Flacaltenn set us both straight with his post:It appears from post #200 that you believe the current average global temperature is 15C.
Except that AGT is hardly ever mentioned. The whole metrics for GW is based on "normalized" GMAST.
Good God, again, you claim to be an engineer?No. The slopes are not very different. Use your eyes. But even if they were, that doesn't mean diddly squat. The reality is that we are still below the peak temperatures of the last 4 interglacial cycles. What part of this do you not understand?LOL Goddamn! Engineer, eh? Lordy, lordy. The slopes of the lines are very different on a graph with the same scales for time and temperature. That you cannot grasp that puts a lie to your claim to be an engineer.Sure. By inspection I don't see any difference either.It doesn't matter what the graphs represent. The slopes are still easily calculable from the data that they do show.It's not that they can't. It is that the data from past climates does not have the resolution to do so. They can't tell you what it was from year to year or even decade to decade with any precision.
In the upper graph, on the Y axis, the distance for ten degrees is the same as the distance for one degree on the bottom graph. On the X axis, the distance on the upper graph for 200,000 years is only about 700 years on the bottom graph. So the slopes are very different if you put them on the same scales. It took, on the upper graph, a minimum of ten thousand years to warm from the bottom of the glacial, to the maximum warmth of the interglacial. That is less than a degree every thousand years.
So, on the bottom graph, put a dot at -1 degrees at 500. Now put a dot at 0 degrees at 1500. Draw a line between them. That is your slope for the glacial to interglacial warmup. Now look at that slope on the last 150 years. That is a fairly accurate comparison of the two slopes. Dingleberry, you are rapidly demonstrating that you intellect is in the same class as SSDD and Frankie boi.[/QUOTE]
My goodness. You are an idiot. Slope is a calculation. The difference you are trying to distinguish is resolution. There is not enough resolution from ice core data to make a valid comparison. Furthermore, even if there were it would meaningless.
Not quite. You were so far from what agt is that your statement was idiotic and showed that you have no idea what we have been discussing. What do you do for a living?I was referring to the yearly global average temperature. Flacaltenn set us both straight with his post:It appears from post #200 that you believe the current average global temperature is 15C.
Except that AGT is hardly ever mentioned. The whole metrics for GW is based on "normalized" GMAST.
Lol. Right. He failed to put the decimal in. You do realize that both graphs were plotting temperature in agt, right?Well, I would guess that he failed to put the decimal point in. As for what he does for a living, which McD's do you flip burgers for? No engineer would make that mistake of stating that the slopes on the two graphs you repeatedly post are the same.Don't be stupid, that is the unit of measure not the reference point.The Celsius scale. It is defined by ice at 0C, and the boiling point of water at 100C.lol, and what is the reference point for AGT?
The reference point is a temperature from a specific year. The AGT is a delta temperature from the reference temperature. Which is why I spewed coke all over my keyboard wen you stated that the AGT was 15C. It appears from post #200 that you believe the current average global temperature is 15C.
What do you do for a living exactly?
Old Rocks
Diamond Member
- Thread starter
- #214
My goodness. You are an idiot. Slope is a calculation. The difference you are trying to distinguish is resolution. There is not enough resolution from ice core data to make a valid comparison. Furthermore, even if there were it would meaningless.[/QUOTE]Good God, again, you claim to be an engineer?No. The slopes are not very different. Use your eyes. But even if they were, that doesn't mean diddly squat. The reality is that we are still below the peak temperatures of the last 4 interglacial cycles. What part of this do you not understand?LOL Goddamn! Engineer, eh? Lordy, lordy. The slopes of the lines are very different on a graph with the same scales for time and temperature. That you cannot grasp that puts a lie to your claim to be an engineer.Sure. By inspection I don't see any difference either.It doesn't matter what the graphs represent. The slopes are still easily calculable from the data that they do show.
In the upper graph, on the Y axis, the distance for ten degrees is the same as the distance for one degree on the bottom graph. On the X axis, the distance on the upper graph for 200,000 years is only about 700 years on the bottom graph. So the slopes are very different if you put them on the same scales. It took, on the upper graph, a minimum of ten thousand years to warm from the bottom of the glacial, to the maximum warmth of the interglacial. That is less than a degree every thousand years.
So, on the bottom graph, put a dot at -1 degrees at 500. Now put a dot at 0 degrees at 1500. Draw a line between them. That is your slope for the glacial to interglacial warmup. Now look at that slope on the last 150 years. That is a fairly accurate comparison of the two slopes. Dingleberry, you are rapidly demonstrating that you intellect is in the same class as SSDD and Frankie boi.
So, you have a rise of about 1 degree in a thousand years, and you have a rise of over 1 degree in 150 years, and you are stating that you cannot see them on the lower graph? Man, no way you are an engineer. Yes, you can calculate the slope of a line, but you can also graph that line. And the line on that graph from -1.0 degrees at 500, to 0 degrees at 1500, a span of 1000 years, has a far lower slope than the line on that graph that shows the slope of the rise in the last 150 years. That you would argue with that demonstrates you are completely unable to read simple graphs.
Old Rocks
Diamond Member
- Thread starter
- #215
Gotta love it when the deniers double down on stupid.Lol. Right. He failed to put the decimal in. You do realize that both graphs were plotting temperature in agt, right?Well, I would guess that he failed to put the decimal point in. As for what he does for a living, which McD's do you flip burgers for? No engineer would make that mistake of stating that the slopes on the two graphs you repeatedly post are the same.Don't be stupid, that is the unit of measure not the reference point.The Celsius scale. It is defined by ice at 0C, and the boiling point of water at 100C.lol, and what is the reference point for AGT?
The reference point is a temperature from a specific year. The AGT is a delta temperature from the reference temperature. Which is why I spewed coke all over my keyboard wen you stated that the AGT was 15C. It appears from post #200 that you believe the current average global temperature is 15C.
What do you do for a living exactly?
The boy is an idiot. He knows it was no decimal error.Gotta love it when the deniers double down on stupid.Lol. Right. He failed to put the decimal in. You do realize that both graphs were plotting temperature in agt, right?Well, I would guess that he failed to put the decimal point in. As for what he does for a living, which McD's do you flip burgers for? No engineer would make that mistake of stating that the slopes on the two graphs you repeatedly post are the same.Don't be stupid, that is the unit of measure not the reference point.The Celsius scale. It is defined by ice at 0C, and the boiling point of water at 100C.lol, and what is the reference point for AGT?
The reference point is a temperature from a specific year. The AGT is a delta temperature from the reference temperature. Which is why I spewed coke all over my keyboard wen you stated that the AGT was 15C. It appears from post #200 that you believe the current average global temperature is 15C.
What do you do for a living exactly?
Good God, again, you claim to be an engineer?No. The slopes are not very different. Use your eyes. But even if they were, that doesn't mean diddly squat. The reality is that we are still below the peak temperatures of the last 4 interglacial cycles. What part of this do you not understand?LOL Goddamn! Engineer, eh? Lordy, lordy. The slopes of the lines are very different on a graph with the same scales for time and temperature. That you cannot grasp that puts a lie to your claim to be an engineer.Sure. By inspection I don't see any difference either.
In the upper graph, on the Y axis, the distance for ten degrees is the same as the distance for one degree on the bottom graph. On the X axis, the distance on the upper graph for 200,000 years is only about 700 years on the bottom graph. So the slopes are very different if you put them on the same scales. It took, on the upper graph, a minimum of ten thousand years to warm from the bottom of the glacial, to the maximum warmth of the interglacial. That is less than a degree every thousand years.
So, on the bottom graph, put a dot at -1 degrees at 500. Now put a dot at 0 degrees at 1500. Draw a line between them. That is your slope for the glacial to interglacial warmup. Now look at that slope on the last 150 years. That is a fairly accurate comparison of the two slopes. Dingleberry, you are rapidly demonstrating that you intellect is in the same class as SSDD and Frankie boi.
So, you have a rise of about 1 degree in a thousand years, and you have a rise of over 1 degree in 150 years, and you are stating that you cannot see them on the lower graph? Man, no way you are an engineer. Yes, you can calculate the slope of a line, but you can also graph that line. And the line on that graph from -1.0 degrees at 500, to 0 degrees at 1500, a span of 1000 years, has a far lower slope than the line on that graph that shows the slope of the rise in the last 150 years. That you would argue with that demonstrates you are completely unable to read simple graphs.
I guess I am going to have to show you graphically what I am saying for you to understand.
gipper
Diamond Member
- Jan 8, 2011
- 81,396
- 45,345
- 2,605
DAMN ITS COLD OUTSIDE!!!Gotta love it when the deniers double down on stupid.Lol. Right. He failed to put the decimal in. You do realize that both graphs were plotting temperature in agt, right?Well, I would guess that he failed to put the decimal point in. As for what he does for a living, which McD's do you flip burgers for? No engineer would make that mistake of stating that the slopes on the two graphs you repeatedly post are the same.Don't be stupid, that is the unit of measure not the reference point.The Celsius scale. It is defined by ice at 0C, and the boiling point of water at 100C.lol, and what is the reference point for AGT?
The reference point is a temperature from a specific year. The AGT is a delta temperature from the reference temperature. Which is why I spewed coke all over my keyboard wen you stated that the AGT was 15C. It appears from post #200 that you believe the current average global temperature is 15C.
What do you do for a living exactly?
gipper
Diamond Member
- Jan 8, 2011
- 81,396
- 45,345
- 2,605
Well, make it worthwhile.
Great tune. Buble is not a kooky loony dupey warmer like you.
Similar threads
- Replies
- 264
- Views
- 4K
- Replies
- 10
- Views
- 271
- Replies
- 0
- Views
- 193
- Replies
- 2
- Views
- 252
New Topics
-
 Israeli Intelligence Shin Bet Says Netanyahu "Enabled" Oct. 7 by Funding Hamas
- Started by munkle
- Replies: 1
-
 FOREIGN $$ SINGHAM! Who's Socialist Singham behind Islamo-Socialist Hasan Piker backstabbing in Cuba?
- Started by Pastelli
- Replies: 2
-
