They have a list at Watts Up.......usually with photos showing the temperature reader under the exhaust fan of an airconditioning unit...
Here ....a quick look...
As indicated in a 2009 study2, the majority of weather stations used by NOAA to detect the climate change temperature signal have been compromised by encroachment of artificial surfaces like concrete, asphalt, and heat sources like air conditioner exhausts.
Figure 1 – USHCN weather station used for climate data in a parking lot. University of Arizona Atmospheric Sciences Department, Tucson. The station had previously been in a grassy area but got moved as the campus grew.
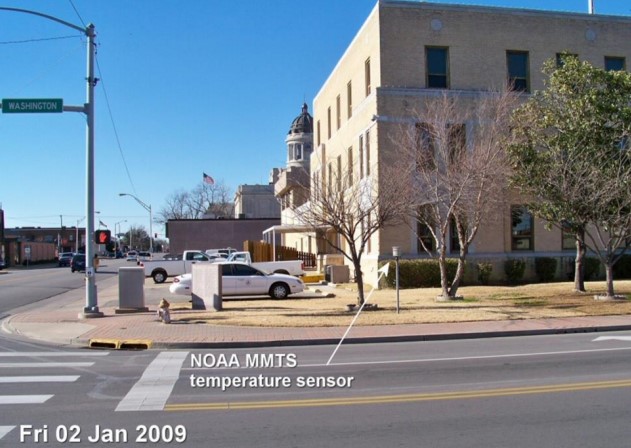
Figure 2 – NOAA MMTS temperature sensor (used for climate data) located on street corner in Ardmore, OK in full viewshed of multiple heatsinks.
An official U.S. Climate monitoring station, operated by NOAA/NWS at the University of Arizona, Tucson. It has been closed since it was revealed that it was sited in a hot parking lot. Pro: Multipl…

everythingclimate.com
Here......a whole report on corrupted temperature stations...
The 2009 report surveyed and photographed more than 850 USHCN stations, providing an analysis of their temperature data. The peer-reviewed paper was published and distributed to thousands of lawmakers, scholars, and scientists. Some of the most important findings in the original report are listed below:
• Many climate monitoring stations were located next to exhaust fans of air conditioning units, surrounded by asphalt parking lots and roads, located on blistering-hot rooftops, or placed near sidewalks and buildings that absorb and radiate heat.
- Sixty-eight stations were located at waste-water treatment plants (WWTP), where the process of waste digestion creates higher temperatures than in surrounding areas. In addition, the infrastructure of WWTPs is almost entirely asphalt and concrete, making them unrepresentative of the surrounding area and unsuitable for thermometer placement to measure long-term changes in temperature.
- Approximately 90 percent of the USHCN stations failed to meet the NWS’s own siting requirements, which stipulate that stations must be 30 meters (100 feet) or more away from an artificial or radiating / reflecting heat source.8 A rating system based on official NOAA documents was employed to assess each station.9 See Figure 3.
Many stations often had missing, incomplete, or erroneous data, perhaps due to the volunteer-based network of observers who could not always record or report data based upon illness, week-day only reporting, and/or vacation days.
- The report found that major gaps in the data record were “infilled” with temperature data from nearby sites, compounding errors from other stations that were also non-compliant with station siting requirements.
- The report observed that changes in the technology of temperature stations over time resulted in many being placed closer to buildings, as well as other heat sinks such as asphalt, concrete, and brick infrastructure. In some cases, official NWS thermometers were moved to parking lots and next to external heat-generating air conditioner units from previously cooler locations that were no longer available for thermometer placement. See Figure 4.
- --------------
- The report concluded that nine of every 10 USHCN stations were likely reporting inaccurately high temperatures because they were poorly sited and in violation of NOAA / NWS published standards for thermometer placement.12 An additional rating system was also used, pioneered by Michel Leroy of Météo-France, which allowed classification of stations by distance to buildings, asphalt, concrete, and other man-made influences.13
- The report suggested that adjustments to the temperature data by NOAA / NCEI also cause recent temperatures to appear higher, due to the infilling mechanism for missing data employed during creation of a national temperature average, as well as other adjustments.