Ah yes, the moldy old denier cult myths - "warming stopped in 1998' & 'temperatures flat for last decade'.
Global warming greatest in past decade
PhysOrg.com
September 1, 2008
(excerpts)
Researchers confirm that surface temperatures in the Northern Hemisphere were warmer over the last 10 years than any time during the last 1300 years, and, if the climate scientists include the somewhat controversial data derived from tree-ring records, the warming is anomalous for at least 1700 years.
"Some have argued that tree-ring data is unacceptable for this type of study," says Michael Mann, associate professor of meteorology and geosciences and director of Penn State's Earth System Science Center. "Now we can eliminate tree rings and still have enough data from other so-called 'proxies' to derive a long-term Northern Hemisphere temperature record." The proxies used by the researchers included information from marine and lake sediment cores, ice cores, coral cores and tree rings. "We looked at a much expanded database and our methods are more sophisticated than those used previously," says Mann.
What has global warming done since 1998?
Last updated on 18 December 2011
(excerpts)
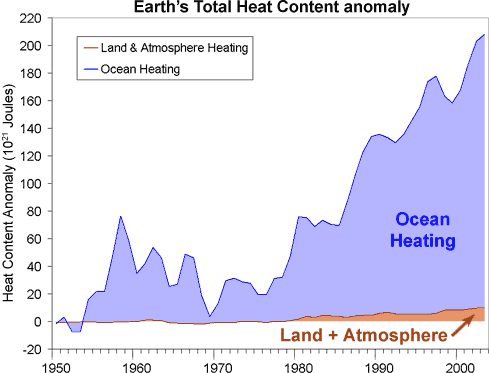
To claim global warming stopped in 1998 overlooks one simple physical reality - the land and atmosphere are just a small fraction of the Earth's climate (albeit the part we inhabit). The entire planet is accumulating heat due to an energy imbalance. The atmosphere is warming. Oceans are accumulating energy. Land absorbs energy and ice absorbs heat to melt. To get the full picture on global warming, you need to view the Earth's entire heat content.
This analysis is performed in An observationally based energy balance for the Earth since 1950 (Murphy 2009) which adds up heat content from the ocean, atmosphere, land and ice. To calculate the Earth's total heat content, the authors used data of ocean heat content from the upper 700 metres. They included heat content from deeper waters down to 3000 metres depth. They computed atmospheric heat content using the surface temperature record and the heat capacity of the troposphere. Land and ice heat content (the energy required to melt ice) were also included.
Figure 1: Total Earth Heat Content anomaly from 1950 (Murphy 2009). Ocean data taken from Domingues et al 2008. Land + Atmosphere includes the heat absorbed to melt ice.
A look at the Earth's total heat content clearly shows global warming has continued past 1998. The planet is still accumulating heat. So why do surface temperature records show 1998 as the hottest year on record? We see in Figure 1 that the heat capacity of the land and atmosphere is small compared to the ocean. Hence, relatively small exchanges of heat between the atmosphere and ocean can cause significant changes in surface temperature.
In 1998, an abnormally strong El Nino caused heat transfer from the Pacific Ocean to the atmosphere. Consequently, we experienced above average surface temperatures. Conversely, the last few years have seen moderate La Nina conditions which had a cooling effect on global temperatures. And the last few months have swung back to warmer El Nino conditions. This has coincided with the warmest June-August sea surface temperatures on record. This internal variation where heat is shuffled around our climate is the reason why surface temperature is such a noisy signal.
CO2 is definitely more important than either one of those in the long term. CO2 levels can keep increasing indefinitely and the greenhouse effects will get greater. Cloud cover can both reflect sunlight away from the Earth and trap heat energy underneath them (clear winter nights are much colder than cloud covered winter nights) and the ENSO variations just move the heat around between the atmosphere and the oceans. Rising CO2 levels will inevitably trap even more heat energy in the Earth's atmosphere and oceans.
I'm more interested in what the professional climate scientists "
think" than what some confused and deluded random bystander like yourself "
thinks". That you are in fact a deluded tool of the fossil fuel industry is clearly revealed by your use of the idiotic and meaningless denier cult phrase: "
CO2 cul-de-sac". The fact that you deny the scientifically established physics of greenhouse gases shows you to be just another anti-science righwingnut clueless denier dupe.
I am more interested in what the data say than in the exaggerated and distorted thoughts and conclusions of some of the 'professional climate scientists'. I am even less interested in your
ad homs like "deluded tool of the fossil fuel industry" and "anti-science righwingnut clueless denier dupe". but if that is your style and it makes you happy, go right ahead.
you think I am being duped and deluded but you never consider that you are at risk of the same thing by credulously believing everything as presented to you, especially when you get it via SkepticalScience.
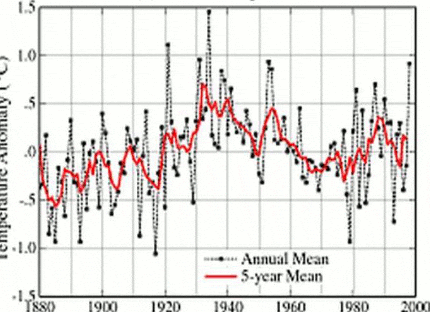
ie- is this graph reasonable or is it emotionally affecting you to come to erroneous conclusions? you have to examine the labelling of the x and y axis and the positioning of the origin. if the intent was to show that the heat content of the atmosphere is miniscule compared to the oceans then it is alright. but if it is trying to show the relative increase of heat content of the oceans it is wildly deceiving. the average global temp is what? ~288K? and the increase has been less than 1K since 1950 so the actual increase in heat content is a very small fraction. are the measurements before ARGO widespread and reliable? not really but we have to start with something. here is a graph of NODC figures since 1955, before and after the adjustment in 2010.

notice that the heat content now looks more like the the global temp curve, which is reasonable. another thing to notice is the type of corrections that were made when it was no longer possible to hide decreased rate of warming. unlike Hansen's GISS land temp adjustments that are unaccountable to scrutiny the OHC adjustments had to make sense. so the artificial lowering of older measurements and raising of newer measurements had to be reversed.
I dont mind that you speak up and defend CAGW. once you make up your mind it is hard to change but I have never been close to being convinced that it is the only or even the best description of the realities of the last few hundreds or thousands of years. I do find it disheartening that so many people like you are willing to mix the scientific and political components together and then resort to an us-vs-them mentality where you no longer even think about the direction the evidence is leading.