Old Rocks
Diamond Member
Wasn't the Mann Hockey Stick graph, you idiot.
Follow along with the video below to see how to install our site as a web app on your home screen.
Note: This feature may not be available in some browsers.
Please site posts where I believe the things that you acuse me of believing.
Note that most of the statements that I make in posts I back up with articles, often from peer reviewed literature.
Appeal to authority, damned right. When trying to understand climate, a PHd climatologist is a far better source than a drugged out radio jock.
Escape from a strawman with a strawman. So often your peers end up getting caught in a lie as well. Pardon me for having difficulty with the peer review argument.
******* bullshit, Liberty.
We see constant posts here stating that CO2 has nothing to do with warming, in spite of the absorbtion spectra work done by Tyndal in 1858. Work that has never been refuted.
You, and the rest of these fools, will acknowledge that a decrease 100 ppm of CO2, from 280 to 180 ppm, will shift us from an interglacial period to an ice age, yet you refuse to acknowledge that an increase of 100 ppm of CO2, from 280 to 380 wil have any effect on climate.
You are fools, and deserve contempt as such. You have let ideology trump reality. You are the same kind of peope that gave us the Inquisition.
Moldy Socks:
Why are ice caps thickening?
Or, do you deny the data collected by US Army buoys?
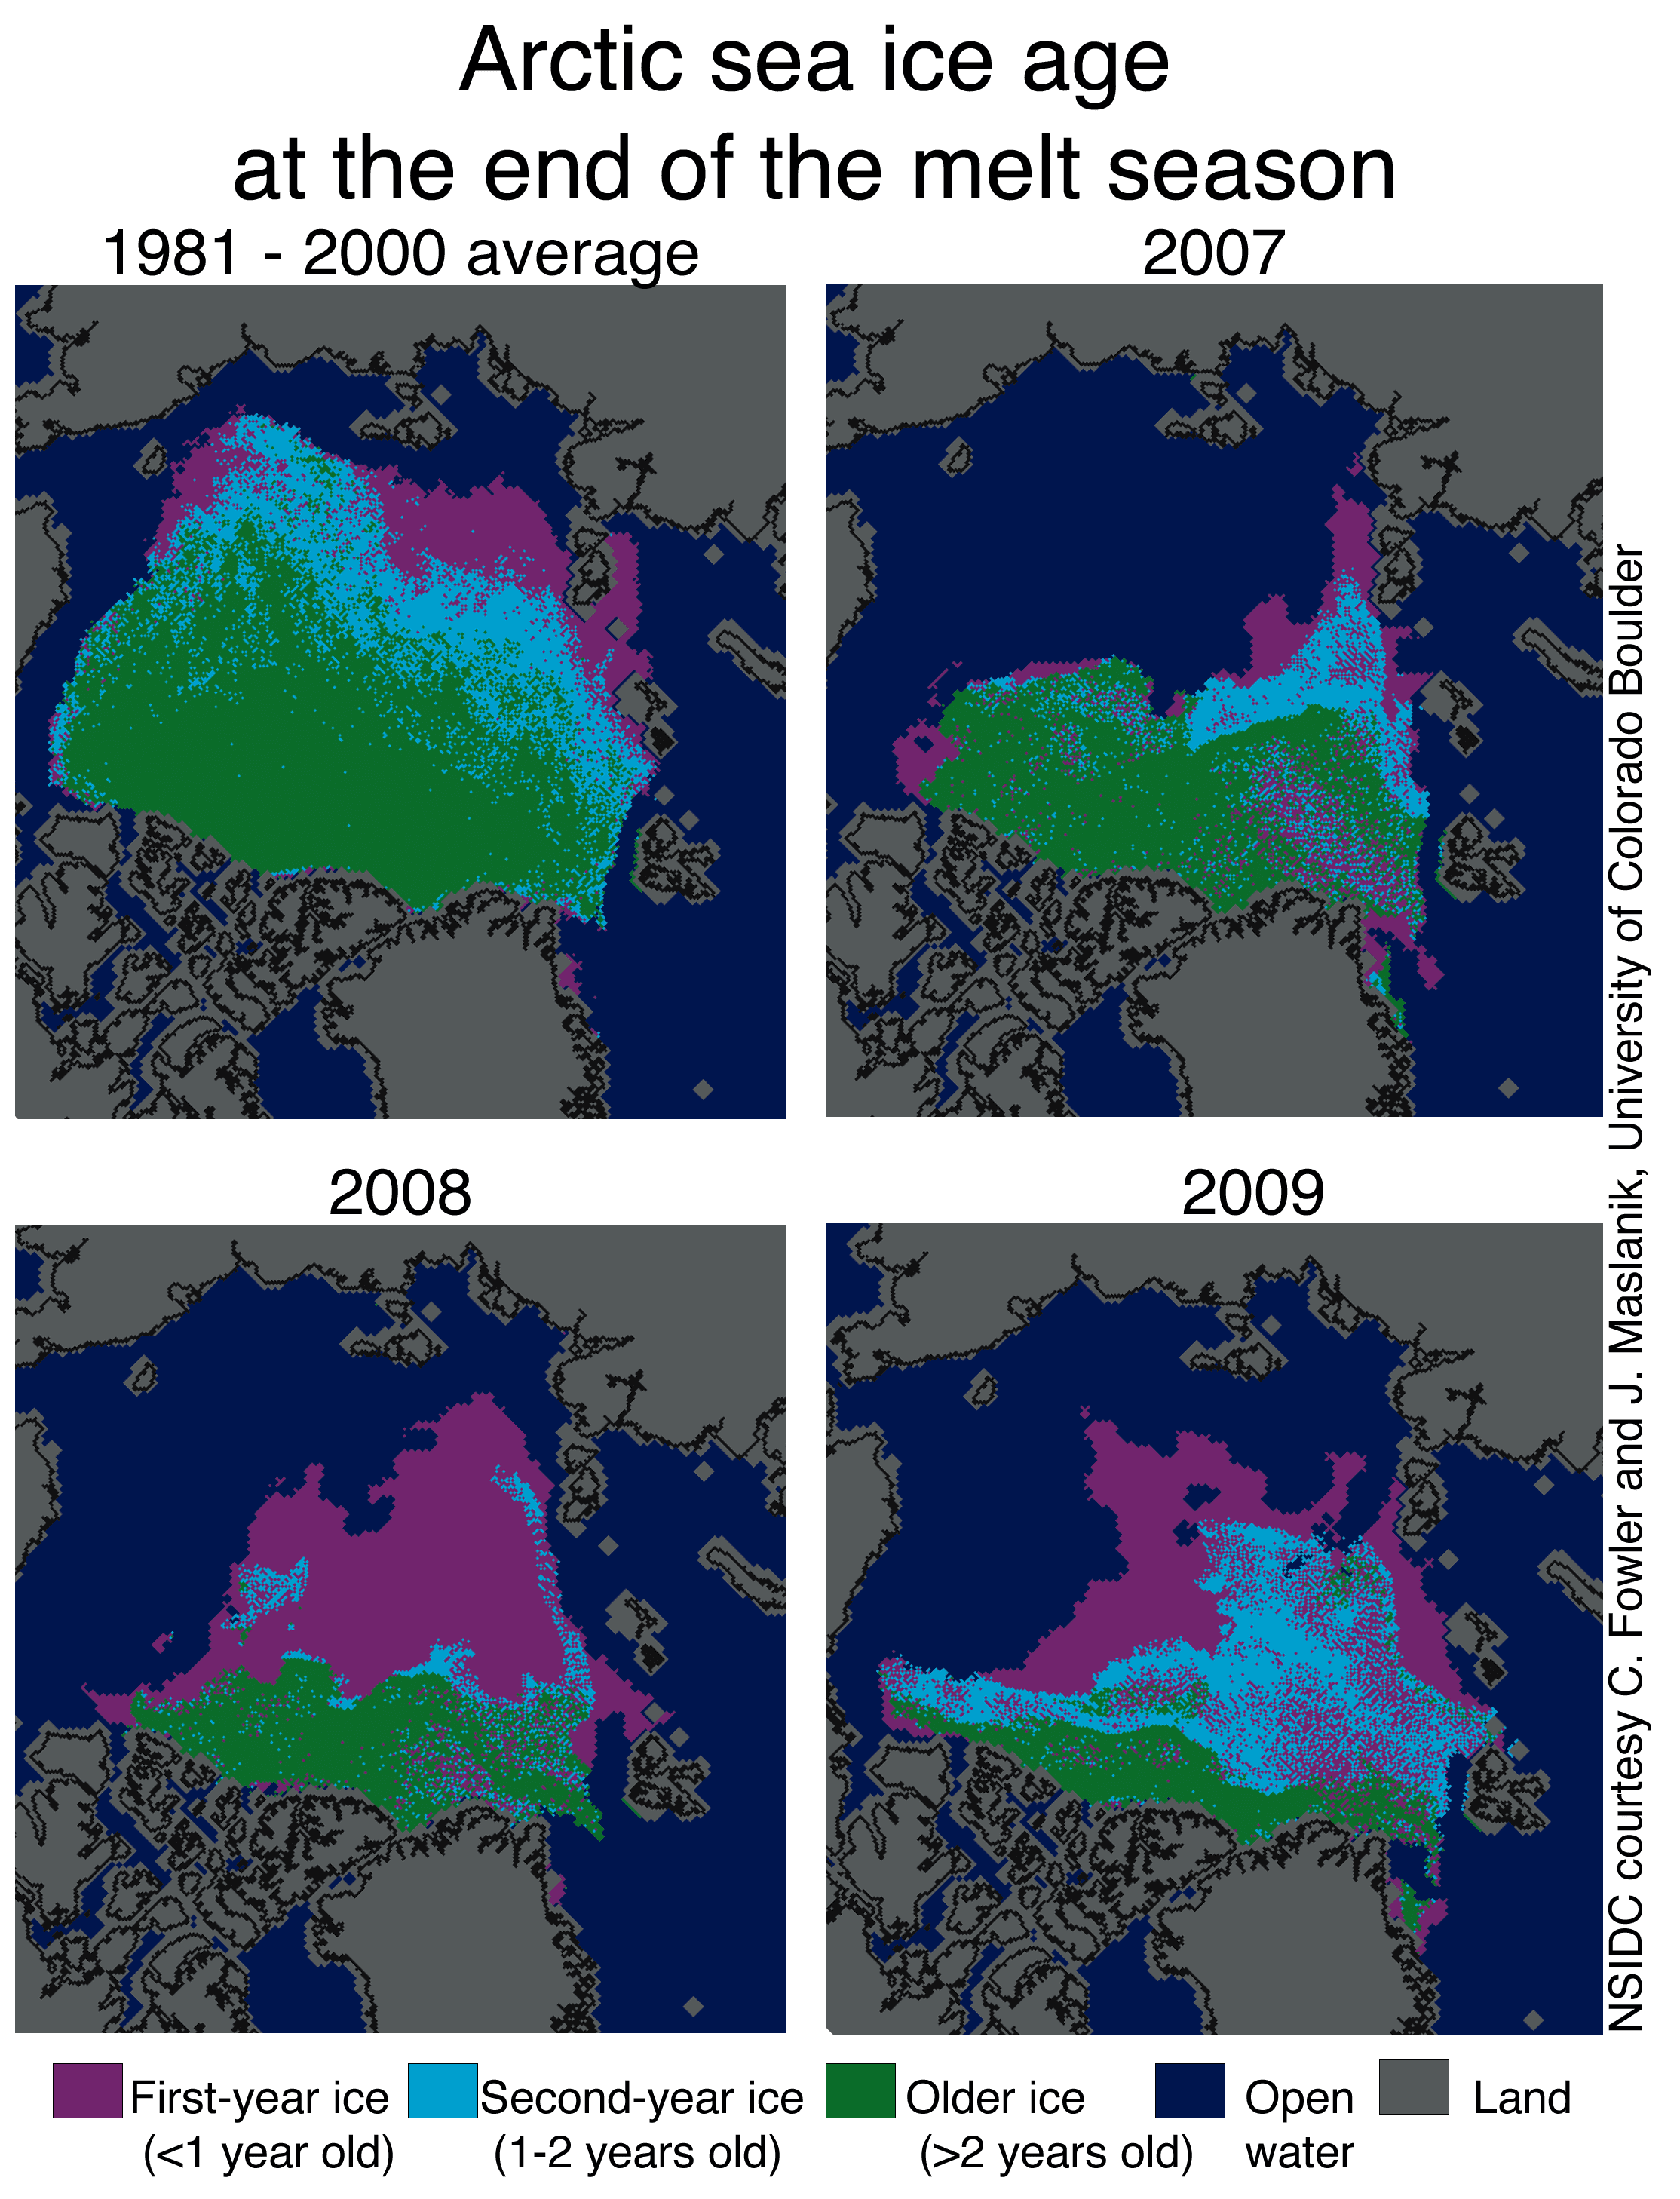
For those keeping some kind of score at home: Monitoring the Arctic Sea Ice
This site gets us into the weird world of ice thickening.

")
Global Cooling is coming. Looks like another bizarre cult is about to be born. What a scam.
World Climate Report Antarctic Ice Melt at Lowest Levels in Satellite Era* * * * Such was the finding reported last week by Marco Tedesco and Andrew Monaghan in the journal Geophysical Research Letters:
A 30-year minimum Antarctic snowmelt record occurred during austral summer 20082009 according to spaceborne microwave observations for 19802009. Strong positive phases of both the El-Niño Southern Oscillation (ENSO) and the Southern Hemisphere Annular Mode (SAM) were recorded during the months leading up to and including the 20082009 melt season.

Figure 1. Standardized values of the Antarctic snow melt index (October-January) from 1980-2009 (adapted from Tedesco and Monaghan, 2009).
The silence surrounding this publication was deafening.
* * * *
All that is "proven" is cultists in the religion of denial know absolutely nothing about how ANOMALIES work and why anomalies are used by real scientists rather than temp readings.My bad. Then they're using the mysteriously declining GSIS weather stations. Or the NOAA weather stations that have been proven to be artificially warmed by local factors violating their placement integrity and now give bad readings.
Home.
The best thing about the Arctic or Greenland deglaciating will be when signs of major human civilizations are uncovered.
Experts say 2006 hurricane season could be as deadly as this year's. - Chicago Tribune (Chicago, IL) | Encyclopedia.com
The best thing about the Arctic or Greenland deglaciating will be when signs of major human civilizations are uncovered.

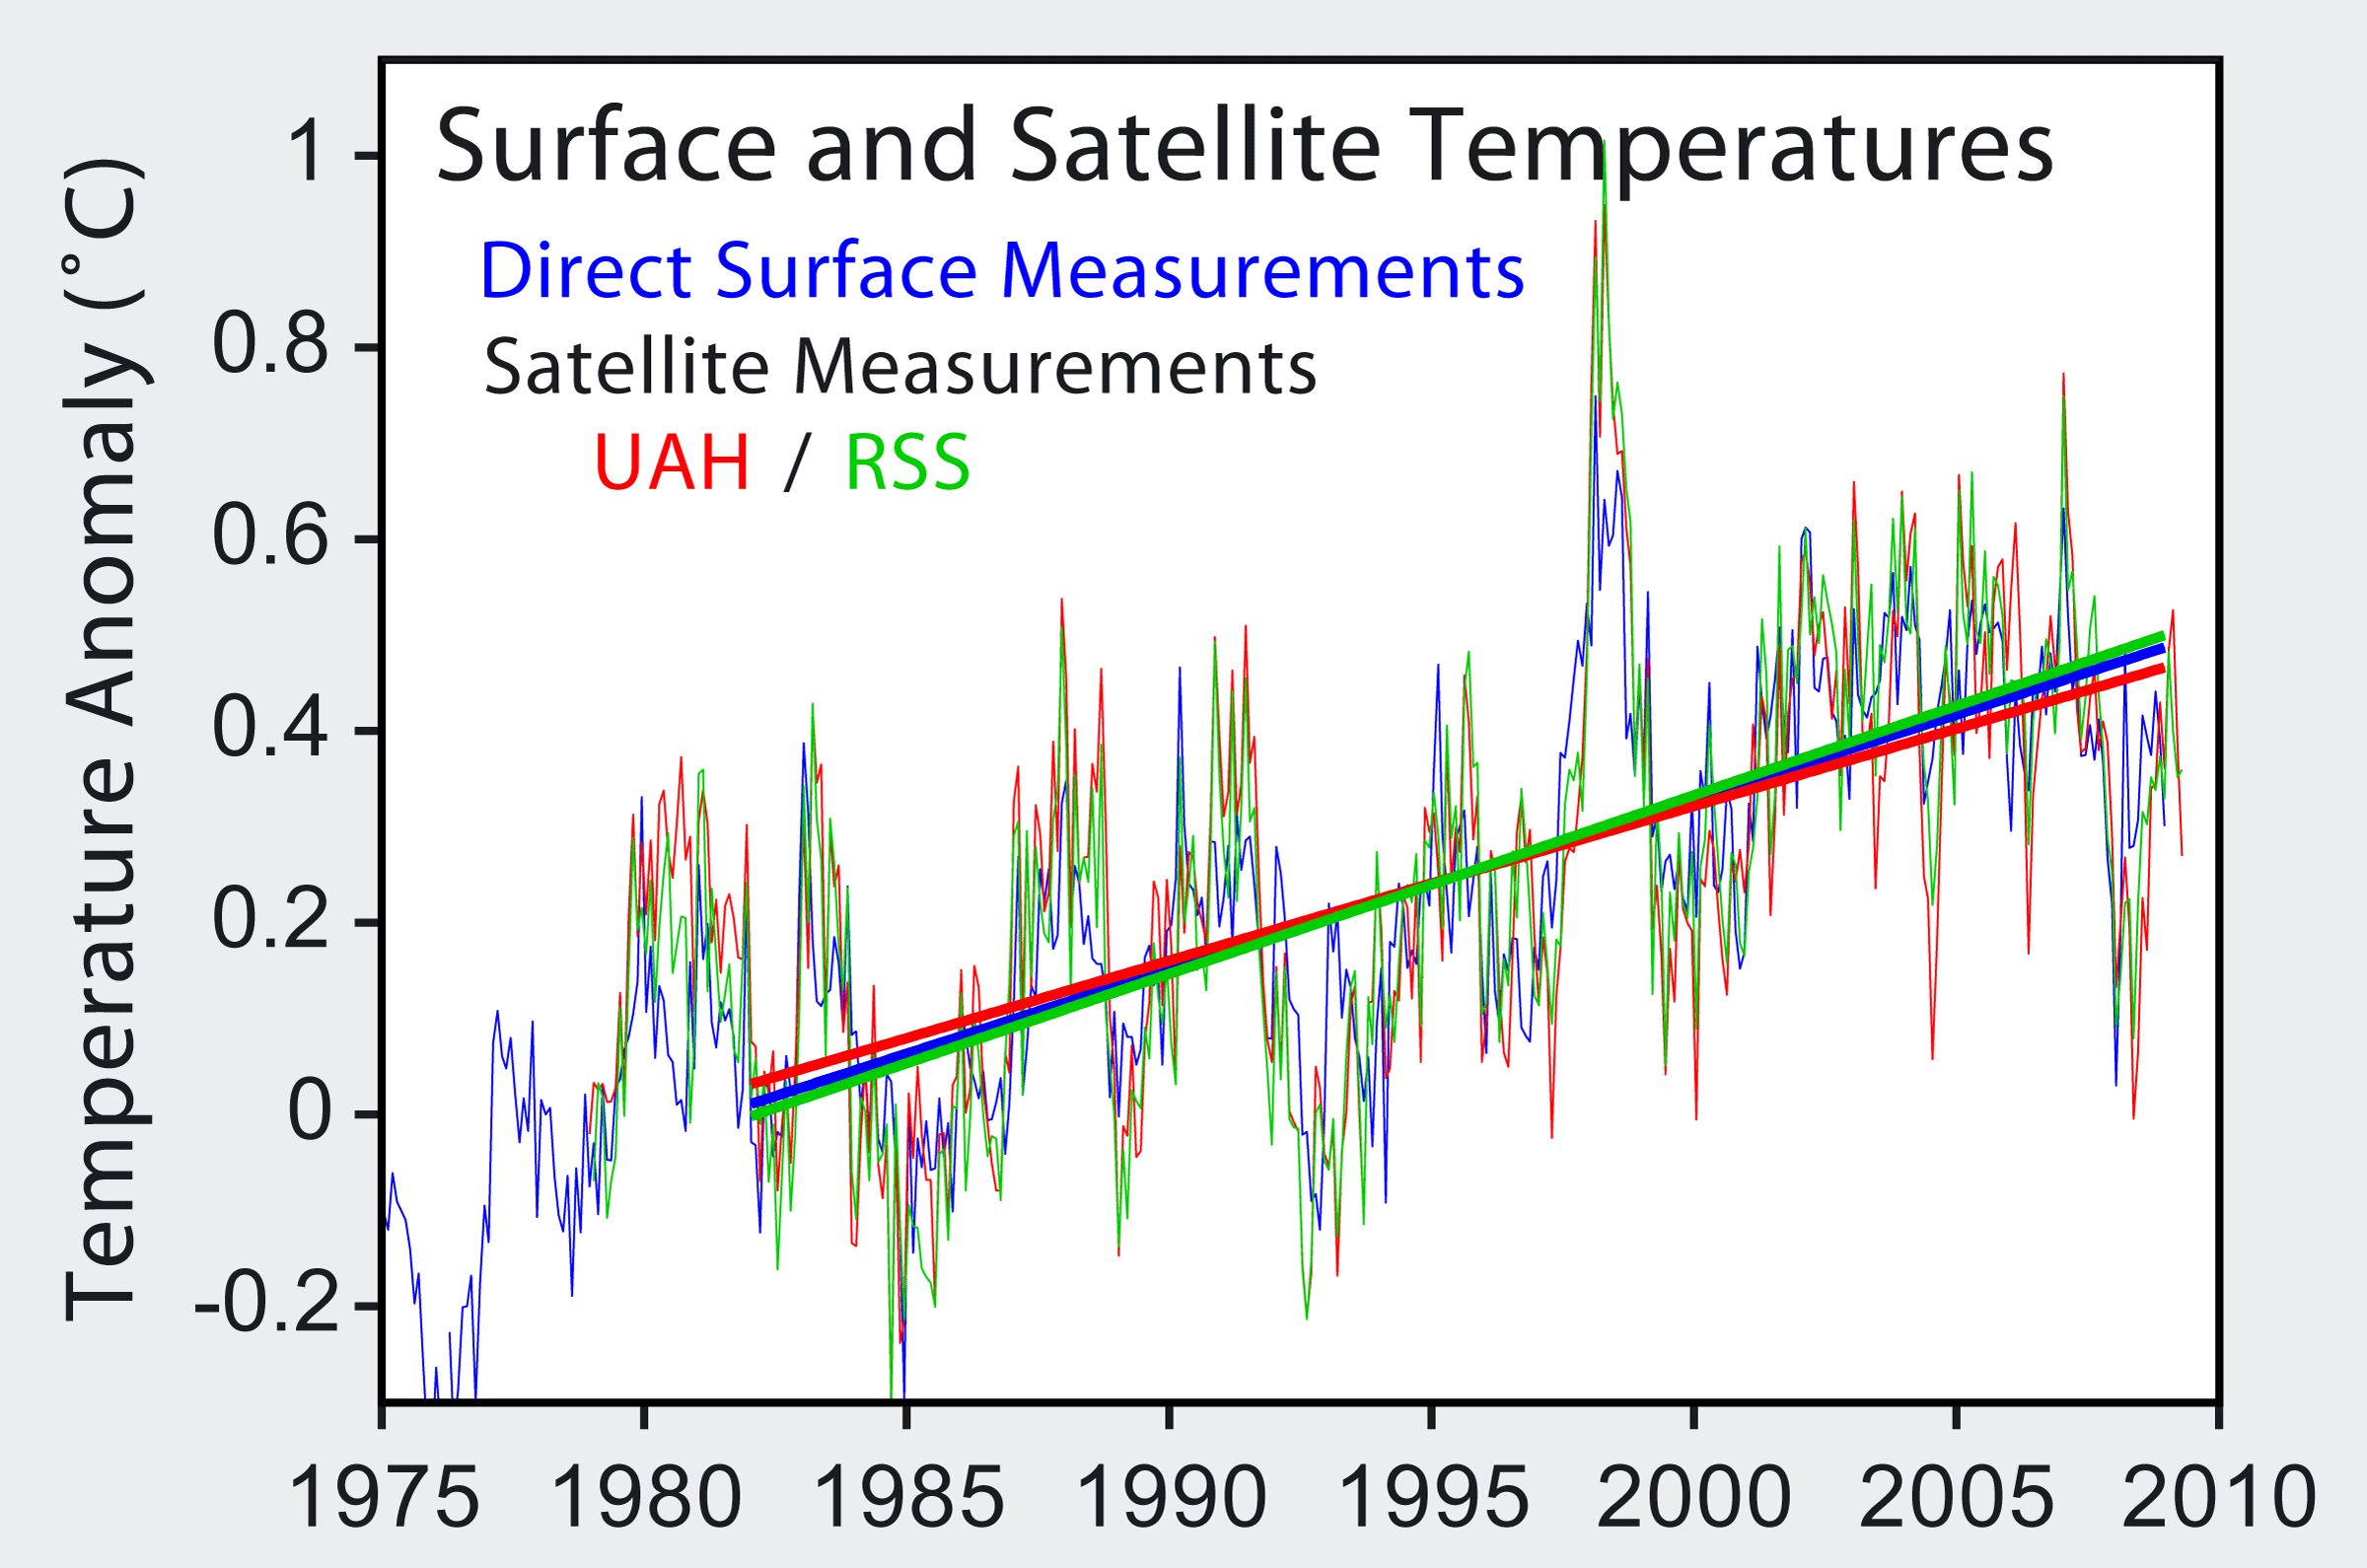
EdtheParrot is back! With a really big nonsensical graph! Like size imports truthiness.
>BARACK!< Anomalies! Anomalies! >Barack oBAMa!<
Then I suppose you see the decline in temps that begins in 2001 too?EdtheParrot is back! With a really big nonsensical graph! Like size imports truthiness.
>BARACK!< Anomalies! Anomalies! >Barack oBAMa!<
Ah yes, and Fritz is back with mindless derision instead of a real answer to the accurate data that Ed has presented.
ANOMALY!...ANOMALY!...ANOMALY!...>BARACK!<Then I suppose you see the decline in temps that begins in 2001 too?EdtheParrot is back! With a really big nonsensical graph! Like size imports truthiness.
>BARACK!< Anomalies! Anomalies! >Barack oBAMa!<
Ah yes, and Fritz is back with mindless derision instead of a real answer to the accurate data that Ed has presented.
Moldy socks:
I note with amusement that you ducked my question. DO you or do you not accept that there is evidence of recent arctic ice thickening?
And, what of the latest data suggesting that the summer melt-off is the lowest since such measurements started getting made by satellites?
The ice melt across during the Antarctic summer (October-January) of 2008-2009 was the lowest ever recorded in the satellite history.
World Climate Report Antarctic Ice Melt at Lowest Levels in Satellite Era* * * * Such was the finding reported last week by Marco Tedesco and Andrew Monaghan in the journal Geophysical Research Letters:
A 30-year minimum Antarctic snowmelt record occurred during austral summer 20082009 according to spaceborne microwave observations for 19802009. Strong positive phases of both the El-Niño Southern Oscillation (ENSO) and the Southern Hemisphere Annular Mode (SAM) were recorded during the months leading up to and including the 20082009 melt season.
Figure 1. Standardized values of the Antarctic snow melt index (October-January) from 1980-2009 (adapted from Tedesco and Monaghan, 2009).
The silence surrounding this publication was deafening.
* * * *