The
NOAA doesn't accept the claims a fact you ignored which is why Sherwoods paper was savaged because it was STUPID sad that you and cartoon asshole Cook will lie away this inconvenience it is why you guys will lie when challenged but be very quiet hoping no one else sees it.
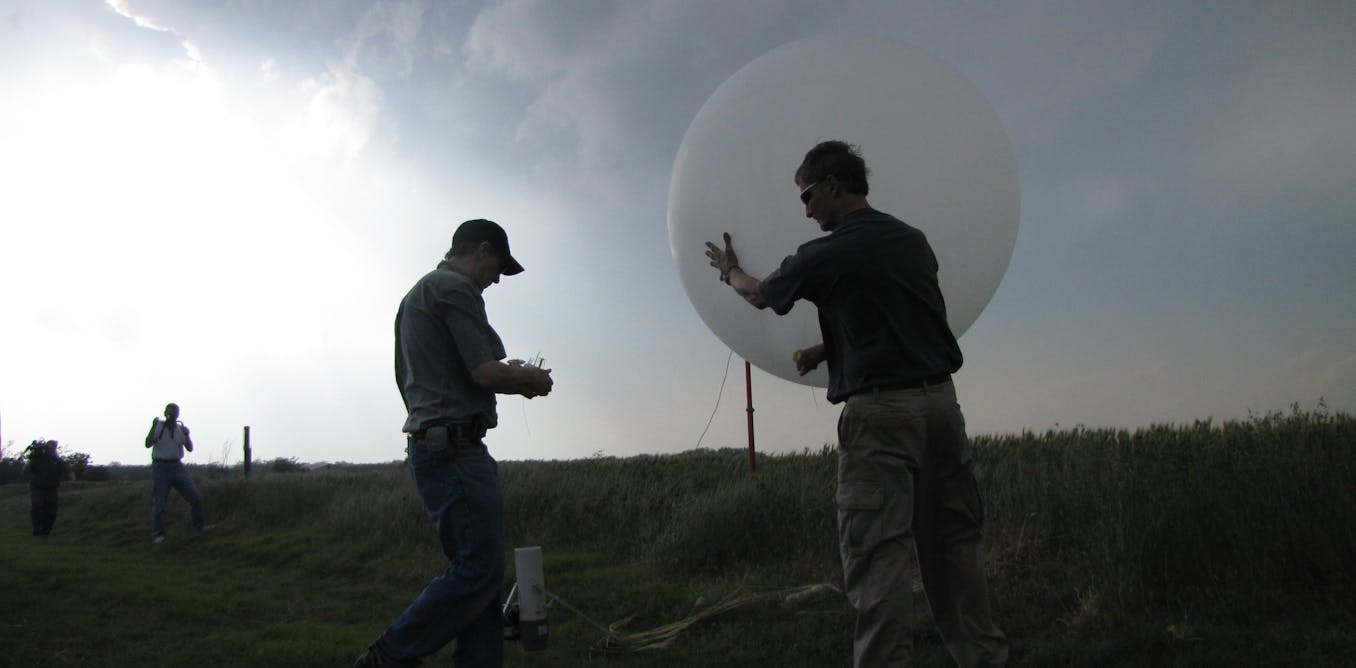
Integrated Global Radiosonde Archive (IGRA)
LINK
You and dishonest SKS ignored what the IPCC specifically stated which I quoted in full:
red bolding mine
Here is the data based chart from climate4you
The initial versions of satellite and radiosonde datasets suggested that the tropical surface had warmed more than the troposphere, while climate models consistently showed tropospheric amplification of surface warming in response to human-caused increases in well-mixed greenhouse gases, as shown by the diagrams above. This observation gave rise to deep concern, and resulted in a number of studies (e.g. NRC 2000) where strong attempts were made to find warming in the troposphere. As new data sets have been made available and new corrections introduced, the scientific literature have witnessed a number of attempts of reconciling the modelled and the observed atmospheric warming pattern. Conflicting conclusions have, however, been reached. Some scientists conclude that a discrepancy between modelled and observed trends in tropical lapse rates still exists, while other argue that there is no longer a serious discrepancy. A few key references on this debate are represented by Lindzen 1999 and 2007, NRC 2000, Douglass et al 2007, and Santer et al 2008. Ongoing web-based discussions can be followed here and here. This debate reflects the importance of the point raised by Lindzen (1999) on monitoring temperature changes at the height in the troposphere corresponding to an infrared optical depth near 1.
View attachment 852447
Diagram showing observed linear decadal temperature change at surface, 300 hPa and 200 hPa, between 20oN and 20oS, since January 1979. Data source: HadAT and HadCRUT4. Click here to compare with modelled altitudinal temperature change pattern for doubling atmospheric CO2. Last month included in analysis: December 2012. Last diagram update: 4 May 2013.
The three diagrams above (using data from HadAT and HadCRUT4) show the linear trend of the temperature change since 1979 between 20oN and 20oS to be ca. 0.00089oC/month at the surface, 0.00095oC/month at 300 hPa, and -0.00009oC/month at 200 hPa, corresponding to 0.10698, 0.11414 and -0.01022oC/decade, respectively (see bar chart above).
Thus, these radiosonde and surface meteorological data from the Equatorial region do not at the moment display the signature of enhanced greenhouse warming. With the observed warming rate of about 0.10698oC/decade at the surface, a warming rate of about 0.21-0.31oC/decade would have been expected at the 200 and 300 hPa levels to comply with the prognosis on this derived from the CO2 hypothesis.
LINK