Where is the MSM when 4 former EPA chiefs disagree with Obama global warming?

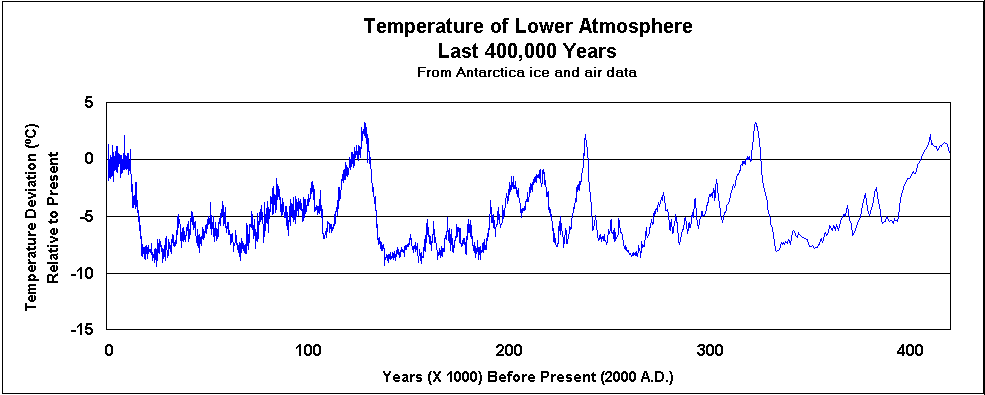
From the following site. Note that it goes back from 2000. Compare that to the NOAA chart from 2000 which shows no warming and certainly does show Obama doesn't know what he is talking about, or cares.

CO2 vs Temperature: Last 400,000 years
Temp_0-400k_yrs.gif
 
I don't believe a word you wrote because who in the f...k are YOU???
NOT one substantiation from any source. For all I know you made all that up!
At least I provide links that you can disprove.
So until as a truly intelligent person would do i.e. include substantiation for your statements YOU are full of CRAP!

I am a retired physicist and therefore understand how anomalies work and why scientists use anomalies to give ACCURATE trend data. You might try picking up a book so you would know whether your "links" are misleading you or not.

Start with the definition of an anomaly:

a·nom·a·ly
əˈnäməlē/
noun
plural noun: anomalies
1.
something that deviates from what is standard, normal, or expected.


Then move to its use in the handling of temperature data:

https://www.ncdc.noaa.gov/monitoring-references/faq/anomalies.php

Background Information - FAQ

What is a temperature anomaly?

The term temperature anomaly means a departure from a reference value or long-term average. A positive anomaly indicates that the observed temperature was warmer than the reference value, while a negative anomaly indicates that the observed temperature was cooler than the reference value.

What can the mean global temperature anomaly be used for?

This product is a global-scale climate diagnostic tool and provides a big picture overview of average global temperatures compared to a reference value.

snip/

Why use temperature anomalies (departure from average) and not absolute temperature measurements?

Absolute estimates of global average surface temperature are difficult to compile for several reasons. Some regions have few temperature measurement stations (e.g., the Sahara Desert) and interpolation must be made over large, data-sparse regions. In mountainous areas, most observations come from the inhabited valleys, so the effect of elevation on a region's average temperature must be considered as well. For example, a summer month over an area may be cooler than average, both at a mountain top and in a nearby valley, but the absolute temperatures will be quite different at the two locations. The use of anomalies in this case will show that temperatures for both locations were below average.

Using reference values computed on smaller [more local] scales over the same time period establishes a baseline from which anomalies are calculated. This effectively normalizes the data so they can be compared and combined to more accurately represent temperature patterns with respect to what is normal for different places within a region.

For these reasons, large-area summaries incorporate anomalies, not the temperature itself. Anomalies more accurately describe climate variability over larger areas than absolute temperatures do, and they give a frame of reference that allows more meaningful comparisons between locations and more accurate calculations of temperature trends.


How is the average global temperature anomaly time-series calculated?

The global time series is produced from the Smith and Reynolds blended land and ocean data set (Smith et al., 2008). This data set consists of monthly average temperature anomalies on a 5° x 5° grid across land and ocean surfaces. These grid boxes are then averaged to provide an average global temperature anomaly. An area-weighted scheme is used to reflect the reality that the boxes are smaller near the poles and larger near the equator. Global-average anomalies are calculated on a monthly and annual time scale. Average temperature anomalies are also available for land and ocean surfaces separately, and the Northern and Southern Hemispheres separately. The global and hemispheric anomalies are provided with respect to the period 1901-2000, the 20th century average.

Why do some of the products use different reference periods?

The national maps show temperature anomalies relative to the 1981–2010 base period. This period is used in order to comply with a recommended World Meteorological Organization (WMO) Policy, which suggests using the latest decade for the 30-year average. For the global-scale averages (global land and ocean, land-only, ocean-only, and hemispheric time series), the reference period is adjusted to the 20th Century average for conceptual simplicity (the period is more familiar to more people, and establishes a longer-term average). The adjustment does not change the shape of the time series or affect the trends within it.


You defined yourself when you wrote:
"You might try picking up a book so you would know whether your "links" are misleading you or not."

Where were my links "misleading"?
Climategatekeeping: Siberia « Climate Audit

Here is a link to US Senate Committee on the Environment that lists in detail 400 scientists who disagree with the anthropomorphic global warming hypothesis:
http://epw.senate.gov/public/index.cfm?FuseAction=Minority.SenateReport


You wrote: For these reasons, large-area summaries incorporate anomalies, not the temperature itself. "Anomalies" not the temperature?
Then why not tell the public these are NOT temperatures but averages of temperatures?

You state the "BASE PERIOD" is 1981 - 2010.
WHY are you excluding the rest of at least American history as the below..
In answering another question related to my 2000 climate study of weather stations around the world and here in the U.S. since 1880, I found that the Depression-wracked decade of the 1930s was the warmest period in at least 120 years, even surpassing the blistering 1990s or the recent decades of the early 2000s.
The coldest decade since 1880 was the 1970s worldwide, a time when many respected climatologists thought that we were heading into a new 'Little Ice Age' or worse. The second coldest decade was the 1940s, which included World War II and my birth in 1942.

NOAA closes 600 poorly-sited weather stations - Coeur d'Alene Press: Weather Gems

Finally there is NOT any disagreement regarding "climate change"....!
What people like me and logical people like you should be is skeptical of the "chicken little, sky is falling", "everything a scientist (physicist) says is TRUE i.e. consensus" and especially our current government's position which is to put America out of business using "global warming" scare tactics.

Because they are NOT averages, they are ANOMALIES which are a DEVIATION from an average, and the data is clearly labeled as ANOMALIES as the graph supplied by one of your fellow deniers shows along the left side! BTW, the average used measure the anomalies against in that graph spans 100 years.

And in regard to your carping about the 30s being the warmest decade, that is for the US only not the globe. The US is 2% of the globe, so it is the height of stupidity to argue that the US temperature should determine the GLOBAL average.

201301-201312.png
 
Last edited:
I am a retired physicist and therefore understand how anomalies work and why scientists use anomalies to give ACCURATE trend data. You might try picking up a book so you would know whether your "links" are misleading you or not.

Start with the definition of an anomaly:

a·nom·a·ly
əˈnäməlē/
noun
plural noun: anomalies
1.
something that deviates from what is standard, normal, or expected.


Then move to its use in the handling of temperature data:

https://www.ncdc.noaa.gov/monitoring-references/faq/anomalies.php

Background Information - FAQ

What is a temperature anomaly?

The term temperature anomaly means a departure from a reference value or long-term average. A positive anomaly indicates that the observed temperature was warmer than the reference value, while a negative anomaly indicates that the observed temperature was cooler than the reference value.

What can the mean global temperature anomaly be used for?

This product is a global-scale climate diagnostic tool and provides a big picture overview of average global temperatures compared to a reference value.

snip/

Why use temperature anomalies (departure from average) and not absolute temperature measurements?

Absolute estimates of global average surface temperature are difficult to compile for several reasons. Some regions have few temperature measurement stations (e.g., the Sahara Desert) and interpolation must be made over large, data-sparse regions. In mountainous areas, most observations come from the inhabited valleys, so the effect of elevation on a region's average temperature must be considered as well. For example, a summer month over an area may be cooler than average, both at a mountain top and in a nearby valley, but the absolute temperatures will be quite different at the two locations. The use of anomalies in this case will show that temperatures for both locations were below average.

Using reference values computed on smaller [more local] scales over the same time period establishes a baseline from which anomalies are calculated. This effectively normalizes the data so they can be compared and combined to more accurately represent temperature patterns with respect to what is normal for different places within a region.

For these reasons, large-area summaries incorporate anomalies, not the temperature itself. Anomalies more accurately describe climate variability over larger areas than absolute temperatures do, and they give a frame of reference that allows more meaningful comparisons between locations and more accurate calculations of temperature trends.


How is the average global temperature anomaly time-series calculated?

The global time series is produced from the Smith and Reynolds blended land and ocean data set (Smith et al., 2008). This data set consists of monthly average temperature anomalies on a 5° x 5° grid across land and ocean surfaces. These grid boxes are then averaged to provide an average global temperature anomaly. An area-weighted scheme is used to reflect the reality that the boxes are smaller near the poles and larger near the equator. Global-average anomalies are calculated on a monthly and annual time scale. Average temperature anomalies are also available for land and ocean surfaces separately, and the Northern and Southern Hemispheres separately. The global and hemispheric anomalies are provided with respect to the period 1901-2000, the 20th century average.

Why do some of the products use different reference periods?

The national maps show temperature anomalies relative to the 1981–2010 base period. This period is used in order to comply with a recommended World Meteorological Organization (WMO) Policy, which suggests using the latest decade for the 30-year average. For the global-scale averages (global land and ocean, land-only, ocean-only, and hemispheric time series), the reference period is adjusted to the 20th Century average for conceptual simplicity (the period is more familiar to more people, and establishes a longer-term average). The adjustment does not change the shape of the time series or affect the trends within it.


You defined yourself when you wrote:
"You might try picking up a book so you would know whether your "links" are misleading you or not."

Where were my links "misleading"?
Climategatekeeping: Siberia « Climate Audit

Here is a link to US Senate Committee on the Environment that lists in detail 400 scientists who disagree with the anthropomorphic global warming hypothesis:
http://epw.senate.gov/public/index.cfm?FuseAction=Minority.SenateReport


You wrote: For these reasons, large-area summaries incorporate anomalies, not the temperature itself. "Anomalies" not the temperature?
Then why not tell the public these are NOT temperatures but averages of temperatures?

You state the "BASE PERIOD" is 1981 - 2010.
WHY are you excluding the rest of at least American history as the below..
In answering another question related to my 2000 climate study of weather stations around the world and here in the U.S. since 1880, I found that the Depression-wracked decade of the 1930s was the warmest period in at least 120 years, even surpassing the blistering 1990s or the recent decades of the early 2000s.
The coldest decade since 1880 was the 1970s worldwide, a time when many respected climatologists thought that we were heading into a new 'Little Ice Age' or worse. The second coldest decade was the 1940s, which included World War II and my birth in 1942.

NOAA closes 600 poorly-sited weather stations - Coeur d'Alene Press: Weather Gems

Finally there is NOT any disagreement regarding "climate change"....!
What people like me and logical people like you should be is skeptical of the "chicken little, sky is falling", "everything a scientist (physicist) says is TRUE i.e. consensus" and especially our current government's position which is to put America out of business using "global warming" scare tactics.

Because they are NOT averages, they are ANOMALIES which are a DEVIATION from an average, and the data is clearly labeled as ANOMALIES as the graph supplied by one of your fellow deniers shows along the left side! BTW, the average used measure the anomalies against in that graph spans 100 years.

And in regard to your carping about the 30s being the warmest decade, that is for the US only not the globe. The US is 2% of the globe, so it the height of stupidity to argue that the US temperature should determine the GLOBAL average.

201301-201312.png

WTF am I denying? Obama made a statement which, according to NOAA not me, is factually incorrect. To that do you disagree? Be honest, raise your hand if you agree that the only data presented in this thread, and it came from NOAA, is wrong and Obama is right.
 
From the following site. Note that it goes back from 2000. Compare that to the NOAA chart from 2000 which shows no warming and certainly does show Obama doesn't know what he is talking about, or cares.

CO2 vs Temperature: Last 400,000 years

Temp_0-400k_yrs.gif

A fairly useless chart! It is the temperature from one area, Antartica, and not the globe, and it is based on proxy data not direct instrument measurement.
 
From the following site. Note that it goes back from 2000. Compare that to the NOAA chart from 2000 which shows no warming and certainly does show Obama doesn't know what he is talking about, or cares.

CO2 vs Temperature: Last 400,000 years

Temp_0-400k_yrs.gif

A fairly useless chart! It is the temperature from one area, Antartica, and not the globe, and it is based on proxy data not direct instrument measurement.

Well then tell me that the NOAA chart is wrong. You are just like Obama, you go for the low hanging fruit.
 
You defined yourself when you wrote:
"You might try picking up a book so you would know whether your "links" are misleading you or not."

Where were my links "misleading"?
Climategatekeeping: Siberia « Climate Audit

Here is a link to US Senate Committee on the Environment that lists in detail 400 scientists who disagree with the anthropomorphic global warming hypothesis:
http://epw.senate.gov/public/index.cfm?FuseAction=Minority.SenateReport


You wrote: For these reasons, large-area summaries incorporate anomalies, not the temperature itself. "Anomalies" not the temperature?
Then why not tell the public these are NOT temperatures but averages of temperatures?

You state the "BASE PERIOD" is 1981 - 2010.
WHY are you excluding the rest of at least American history as the below..
In answering another question related to my 2000 climate study of weather stations around the world and here in the U.S. since 1880, I found that the Depression-wracked decade of the 1930s was the warmest period in at least 120 years, even surpassing the blistering 1990s or the recent decades of the early 2000s.
The coldest decade since 1880 was the 1970s worldwide, a time when many respected climatologists thought that we were heading into a new 'Little Ice Age' or worse. The second coldest decade was the 1940s, which included World War II and my birth in 1942.

NOAA closes 600 poorly-sited weather stations - Coeur d'Alene Press: Weather Gems

Finally there is NOT any disagreement regarding "climate change"....!
What people like me and logical people like you should be is skeptical of the "chicken little, sky is falling", "everything a scientist (physicist) says is TRUE i.e. consensus" and especially our current government's position which is to put America out of business using "global warming" scare tactics.

Because they are NOT averages, they are ANOMALIES which are a DEVIATION from an average, and the data is clearly labeled as ANOMALIES as the graph supplied by one of your fellow deniers shows along the left side! BTW, the average used measure the anomalies against in that graph spans 100 years.

And in regard to your carping about the 30s being the warmest decade, that is for the US only not the globe. The US is 2% of the globe, so it the height of stupidity to argue that the US temperature should determine the GLOBAL average.

201301-201312.png

WTF am I denying? Obama made a statement which, according to NOAA not me, is factually incorrect. To that do you disagree? Be honest, raise your hand if you agree that the only data presented in this thread, and it came from NOAA, is wrong and Obama is right.

Just because Obama was wrong about the limited time frame he used, does not change the fact that the globe is warming. The globe is warming more slowly during the time period Obama gave, but it is still warming. Compare that to your fellow deniers who are claiming the globe has been cooling over the same time period Obama gave. Now it is YOUR turn to be honest, who is the bigger liar, the deniers or Obama?
 
From the following site. Note that it goes back from 2000. Compare that to the NOAA chart from 2000 which shows no warming and certainly does show Obama doesn't know what he is talking about, or cares.

CO2 vs Temperature: Last 400,000 years

Temp_0-400k_yrs.gif

A fairly useless chart! It is the temperature from one area, Antartica, and not the globe, and it is based on proxy data not direct instrument measurement.

Well then tell me that the NOAA chart is wrong. You are just like Obama, you go for the low hanging fruit.

The Antartica chart is not wrong, it is just limited in its scope and useless in a discussion of GLOBAL warming.
Get it?
 
Because they are NOT averages, they are ANOMALIES which are a DEVIATION from an average, and the data is clearly labeled as ANOMALIES as the graph supplied by one of your fellow deniers shows along the left side! BTW, the average used measure the anomalies against in that graph spans 100 years.

And in regard to your carping about the 30s being the warmest decade, that is for the US only not the globe. The US is 2% of the globe, so it the height of stupidity to argue that the US temperature should determine the GLOBAL average.

201301-201312.png

WTF am I denying? Obama made a statement which, according to NOAA not me, is factually incorrect. To that do you disagree? Be honest, raise your hand if you agree that the only data presented in this thread, and it came from NOAA, is wrong and Obama is right.

Just because Obama was wrong about the limited time frame he used, does not change the fact that the globe is warming. The globe is warming more slowly during the time period Obama gave, but it is still warming. Compare that to your fellow deniers who are claiming the globe has been cooling over the same time period Obama gave. Now it is YOUR turn to be honest, who is the bigger liar, the deniers or Obama?

I have not read where many have said we are cooling. What I do read is that many say we have not warmed in 10 years, which is very true. If you wish for me to pass judgment on ANYTHING you need to post fact. Post what someone actually did say and we can discuss it. We know what Obama said is factually not true. Unless he was going back 14 years in his head and just forgot to tell us.

If I were you I would be arguing that CO2 obviously has moderated our temperature. Instead of the normal cycle down the temperature, as witnessed by NOAA's chart, has more or less stabilized. Maybe because there is equilibrium and an increase in CO2 can't cause temperature to increase. That certainly looks like what is happening to me. So in effect maybe a rise in CO2 levels was a good thing. Or maybe all the cooling towers we now have are putting more atmospheric moisture in the air which is really the biggest green house gas.

All that said, no matter what anyone else says, what Obama said was factually incorrect, according to NOAA.
 
A fairly useless chart! It is the temperature from one area, Antartica, and not the globe, and it is based on proxy data not direct instrument measurement.

Well then tell me that the NOAA chart is wrong. You are just like Obama, you go for the low hanging fruit.

The Antartica chart is not wrong, it is just limited in its scope and useless in a discussion of GLOBAL warming.
Get it?

Is the NOAA chart wrong also? Was it created by Republican appointees?
 
When asked this question by Jeff Sessions..

Senator Jeff Sessions says:
"The President on November 14th 2012 said, ‘The temperature around the globe is increasing faster than was predicted, even ten years ago.’ And then on May 29th last year he also said - quote - ‘We also know that the climate is warming faster than anybody anticipated five or ten years ago.’ Close quote.

So I would ask each of our former Administrators if any of you agree that that’s an accurate statement on the climate. So if you do, raise your hand.”
"Thank you," said Senator Sessions. "The record will reflect no one raised their hand."

That’s a 100 per cent consensus that the President’s words were not an “accurate statement”.
- See more at: Four former EPA chiefs refuse to endorse Obama's claims about global warming | Poor Richard's News

NOT ONE single hand of the EPA saying they agree with obama's wild ass claim!!!

I'm curious. What is your agenda?

there is NO agenda, he and i, along with several million other level headed Conservatives are trying our best to inform you ("you", meaning ALL libs) your presidunce hates facts and truth, plus he is a liar of the highest order.., when and what was his last TRUE statement or word ????? :lmao:
 
(from 92 years ago)

Report on Global Warming
Washington Post Nov.2,1922

The Arctic Ocean is warming up, icebergs are growing scarcer and in some places the seals are finding the water too hot, according to a report to the Commerce Department yesterday from Consulafft,at Bergen, Norway.

Reports from fishermen, seal hunters, and explorers all point to a radical change in climate conditions and hitherto unheard-of temperatures in the Arctic zone. Exploration expeditions report that scarcely any ice has been met as far north as 81 degrees 29 minutes.

Soundings to a depth of 3,100 meters showed the gulf stream still very warm. Great masses of ice have been replaced by mountains of earth and stones, the report continued, while at many points well known glaciers have entirely
disappeared.

Very few seals and no white fish are found in the eastern Arctic, while vast shoals of herring and smelts which have never before ventured so far north, are being encountered in the old seal fishing grounds. Within a few years it is predicted that due to the ice melt the sea will rise and make most coastal cities uninhabitable.
Reply With Quote

that is terrible news.., i'll bet the penguins had a hard time of it also. {snark, snark :lmao:}
 
Is there anything more corrupt than the democrats and anything dumber than their little puppets that vote for them?
 
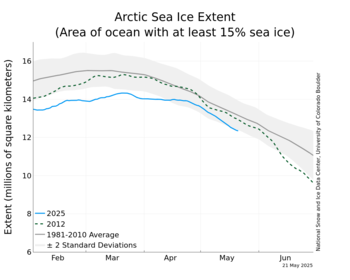
From NSIDC:

Arctic sea ice extent declined at a typical rate through May, but extent remained below average for the period of satellite observations. While Antarctic sea ice extent increased at a near average rate, extent was at a record high, and above average in nearly every Antarctic sea ice sector.

Arctic Sea Ice News and Analysis | Sea ice data updated daily with one-day lag

N_stddev_timeseries_thumb.png


Decreased by is above 2012 and is within standard deviation.
 
Last edited:
who all happen to be Republicans

Once I got to that part, I stopped reading.

Look who right wingers put on the "Science committee".

ooooh ! you mean like DicCaprio ??

[ame=http://www.youtube.com/watch?v=BY__st0Rc6Q]Global Warning (Narrated by Leonardo DiCaprio) - YouTube[/ame]
 
WTF am I denying? Obama made a statement which, according to NOAA not me, is factually incorrect. To that do you disagree? Be honest, raise your hand if you agree that the only data presented in this thread, and it came from NOAA, is wrong and Obama is right.

Just because Obama was wrong about the limited time frame he used, does not change the fact that the globe is warming. The globe is warming more slowly during the time period Obama gave, but it is still warming. Compare that to your fellow deniers who are claiming the globe has been cooling over the same time period Obama gave. Now it is YOUR turn to be honest, who is the bigger liar, the deniers or Obama?

I have not read where many have said we are cooling. What I do read is that many say we have not warmed in 10 years, which is very true. If you wish for me to pass judgment on ANYTHING you need to post fact. Post what someone actually did say and we can discuss it. We know what Obama said is factually not true. Unless he was going back 14 years in his head and just forgot to tell us.

If I were you I would be arguing that CO2 obviously has moderated our temperature. Instead of the normal cycle down the temperature, as witnessed by NOAA's chart, has more or less stabilized. Maybe because there is equilibrium and an increase in CO2 can't cause temperature to increase. That certainly looks like what is happening to me. So in effect maybe a rise in CO2 levels was a good thing. Or maybe all the cooling towers we now have are putting more atmospheric moisture in the air which is really the biggest green house gas.

All that said, no matter what anyone else says, what Obama said was factually incorrect, according to NOAA.

Then you are completely out of touch with reality.

Forget global warming!? Earth undergoing global COOLING since 2002! Climate Scientist Dr. Judith Curry: ?Attention in the public debate seems to be moving away from the 15-17 year ?pause? to the cooling since 2002? | Climate Depot

Forget global warming!? Earth undergoing global COOLING since 2002!

DEMING: Another year of global cooling - Washington Times

Global warming is nowhere to be found. The mean global temperature has not risen in 17 years and has been slowly falling for approximately the past 10 years. In 2013, there were more record-low temperatures than record-high temperatures in the United States.
 
climate change is happening, has been ever since GOD did this:


In the beginning GOD created the Heaven and the Earth.

No, everything happened to happen by chance. Of course when a stat guy like that stat guy tries to apply the statistical probability that everything is a coincidence, he will find that the odds that everything that happened just happens to be a coincidence, he will see the statistical probably is astronomical.

For example.......


The gravitational coupling constant—i.e., the force of gravity, determines what kinds of stars are possible in the universe. If the gravitational force were slightly stronger, star formation would proceed more efficiently and all Stars would be more massive than our sun by at least 1.4 times. These large stars are important in that they alone manufacture elements heavier than iron, and they alone disperse elements heavier than beryllium to the interstellar medium. Such elements are essential for the formation of planets as well as of living things in any form. However, these Stars burn too rapidly and too unevenly to maintain life-supporting conditions on surrounding planets. Stars as small as our sun are necessary for that.

On the other hand, if the gravitational force were slightly weaker, all stars would have less than 0.8 times the mass of the sun. Though such stars burn long and evenly enough to maintain life-supporting planets, no heavy elements essential for building such planets or life would exist.
 
Just because Obama was wrong about the limited time frame he used, does not change the fact that the globe is warming. The globe is warming more slowly during the time period Obama gave, but it is still warming. Compare that to your fellow deniers who are claiming the globe has been cooling over the same time period Obama gave. Now it is YOUR turn to be honest, who is the bigger liar, the deniers or Obama?

I have not read where many have said we are cooling. What I do read is that many say we have not warmed in 10 years, which is very true. If you wish for me to pass judgment on ANYTHING you need to post fact. Post what someone actually did say and we can discuss it. We know what Obama said is factually not true. Unless he was going back 14 years in his head and just forgot to tell us.

If I were you I would be arguing that CO2 obviously has moderated our temperature. Instead of the normal cycle down the temperature, as witnessed by NOAA's chart, has more or less stabilized. Maybe because there is equilibrium and an increase in CO2 can't cause temperature to increase. That certainly looks like what is happening to me. So in effect maybe a rise in CO2 levels was a good thing. Or maybe all the cooling towers we now have are putting more atmospheric moisture in the air which is really the biggest green house gas.

All that said, no matter what anyone else says, what Obama said was factually incorrect, according to NOAA.

Then you are completely out of touch with reality.

Forget global warming!? Earth undergoing global COOLING since 2002! Climate Scientist Dr. Judith Curry: ?Attention in the public debate seems to be moving away from the 15-17 year ?pause? to the cooling since 2002? | Climate Depot

Forget global warming!? Earth undergoing global COOLING since 2002!

DEMING: Another year of global cooling - Washington Times

Global warming is nowhere to be found. The mean global temperature has not risen in 17 years and has been slowly falling for approximately the past 10 years. In 2013, there were more record-low temperatures than record-high temperatures in the United States.

Finding data is really quite a chore. So here is a site that you can choose the date for monthly/yearly continental US, or just states or regions. I did a chart from 2002 to 2014 and in spite of a spike in 2012 it sure looks as if the chart is heading downward. But don't take my word for it look for yourself.

Climate at a Glance | National Climatic Data Center (NCDC)
 

Forum List

Back
Top