Unemployment rates were made worse by Bush, not Obama!

Bush didn't Clinton didn't So fuck off.
Both Bushes did Reagan did, Clinton did, Carter did, Ford did, Nixon did. The next president will no matter who it is!
dumb ass
OK Carter held the record until obama took it from him.
Nope, Reagan set the record after Carter.
As the chart, which the forum jester can't understand, shows. :mm:
Chart shows nothing. The only thing is shows is you can't read a chart.
:banana::asshole:
Stop projecting, Jester:laugh2: It's already been demonstrated that you're the only one who can't read it. :eek: No one else had a problem. Go figure. :dunno:
 
It demonstrates what was said here, which is clearly too complex for your limited d, d! !? t te ?comprehension ... that every president had more people who were not in the labor force than any previous president going as far back as the data allows.
It actually doesn't demonstrate that. Nor is the assertion true.
latest_numbers_LNS11300000_1970_2014_all_period_M09_data.gif
Here's a graph of the workforce participation rate. Note that it goes up from 1970 to about 1990, then starts to decline. After 2008 it declines more severely.
People entered the labor force because they perceived job opportunities. They left for pretty much the opposite reason. Under Obama there is hardly any incentive to work at all.

Your graph show the percentages of people participating in the workforce in a given year. It does not show how many actually had jobs. Faun's graph shows the number of people who were in the workforce but were unemployed in a given year. The LPR and UE are two different things.
The forum :laugh2:jester:laugh2: lacks the brain power to discern the difference; which he managed to demonstrate most eloquently.
It's hard to decide who the biggest board fool is you or John Q?
OH what the hell it's a great day you both can hold the title.
I think they're gay lovers. Or socks. Or something.

Damn, son! You twinks are always trying to project your fantasies on to others.
 
Both Bushes did Reagan did, Clinton did, Carter did, Ford did, Nixon did. The next president will no matter who it is!
dumb ass
OK Carter held the record until obama took it from him.
Nope, Reagan set the record after Carter.
As the chart, which the forum jester can't understand, shows. :mm:
Chart shows nothing. The only thing is shows is you can't read a chart.
:banana::asshole:
Stop projecting, Jester:laugh2: It's already been demonstrated that you're the only one who can't read it. :eek: No one else had a problem. Go figure. :dunno:
That has been demonstrated about as much as what the chart is about.
Which is to say nothing at all.
I think you don't understand what the word "demonstrate" means.
 
dumb ass
OK Carter held the record until obama took it from him.
Nope, Reagan set the record after Carter.
As the chart, which the forum jester can't understand, shows. :mm:
Chart shows nothing. The only thing is shows is you can't read a chart.
:banana::asshole:
Stop projecting, Jester:laugh2: It's already been demonstrated that you're the only one who can't read it. :eek: No one else had a problem. Go figure. :dunno:
That has been demonstrated about as much as what the chart is about.
Which is to say nothing at all.
I think you don't understand what the word "demonstrate" means.
:lmao::lmao::lmao::lmao::lmao:

Pretending you didn't make a fool of yourself, Jester, doesn't help you.

:lmao::lmao::lmao::lmao::lmao:
 
Nope, Reagan set the record after Carter.
As the chart, which the forum jester can't understand, shows. :mm:
Chart shows nothing. The only thing is shows is you can't read a chart.
:banana::asshole:
Stop projecting, Jester:laugh2: It's already been demonstrated that you're the only one who can't read it. :eek: No one else had a problem. Go figure. :dunno:
That has been demonstrated about as much as what the chart is about.
Which is to say nothing at all.
I think you don't understand what the word "demonstrate" means.
:lmao::lmao::lmao::lmao::lmao:

Pretending you didn't make a fool of yourself, Jester, doesn't help you.

:lmao::lmao::lmao::lmao::lmao:
I dont need to pretend. I just need to point out your chart is worthless and you can't explain it.
 
As the chart, which the forum jester can't understand, shows. :mm:
Chart shows nothing. The only thing is shows is you can't read a chart.
:banana::asshole:
Stop projecting, Jester:laugh2: It's already been demonstrated that you're the only one who can't read it. :eek: No one else had a problem. Go figure. :dunno:
That has been demonstrated about as much as what the chart is about.
Which is to say nothing at all.
I think you don't understand what the word "demonstrate" means.
:lmao::lmao::lmao::lmao::lmao:

Pretending you didn't make a fool of yourself, Jester, doesn't help you.

:lmao::lmao::lmao::lmao::lmao:
I dont need to pretend. I just need to point out your chart is worthless and you can't explain it.
Ok, so you weren't pretending.

Meanwhile, you remain the only one here who doesn't understand it. Even after 2 explanations, you still don't get it. Clearly, you don't possess even the minimum mental faculties required to understand it. That's ok, Jester, I doubt anyone here (except you, of course) thought you did.
 
Chart shows nothing. The only thing is shows is you can't read a chart.
:banana::asshole:
Stop projecting, Jester:laugh2: It's already been demonstrated that you're the only one who can't read it. :eek: No one else had a problem. Go figure. :dunno:
That has been demonstrated about as much as what the chart is about.
Which is to say nothing at all.
I think you don't understand what the word "demonstrate" means.
:lmao::lmao::lmao::lmao::lmao:

Pretending you didn't make a fool of yourself, Jester, doesn't help you.

:lmao::lmao::lmao::lmao::lmao:
I dont need to pretend. I just need to point out your chart is worthless and you can't explain it.
Ok, so you weren't pretending.

Meanwhile, you remain the only one here who doesn't understand it. Even after 2 explanations, you still don't get it. Clearly, you don't possess even the minimum mental faculties required to understand it. That's ok, Jester, I doubt anyone here (except you, of course) thought you did.
Nope, still no understanding of what "demonstrate" means.
You might want to try a dictionary or something. Meanwhile your chart remains floating like a turd in the toiletbowl.
 
Stop projecting, Jester:laugh2: It's already been demonstrated that you're the only one who can't read it. :eek: No one else had a problem. Go figure. :dunno:
That has been demonstrated about as much as what the chart is about.
Which is to say nothing at all.
I think you don't understand what the word "demonstrate" means.
:lmao::lmao::lmao::lmao::lmao:

Pretending you didn't make a fool of yourself, Jester, doesn't help you.

:lmao::lmao::lmao::lmao::lmao:
I dont need to pretend. I just need to point out your chart is worthless and you can't explain it.
Ok, so you weren't pretending.

Meanwhile, you remain the only one here who doesn't understand it. Even after 2 explanations, you still don't get it. Clearly, you don't possess even the minimum mental faculties required to understand it. That's ok, Jester, I doubt anyone here (except you, of course) thought you did.
Nope, still no understanding of what "demonstrate" means.
You might want to try a dictionary or something. Meanwhile your chart remains floating like a turd in the toiletbowl.
cries the forum jester who admits he doesn't understand the chart.
Says thea ssclown who can't explain it.

You can't explain it because the chart doesnt make sense.
 
Of course Bush & Clinton both had record numbers of people not in the labor force during their respective presidencies. Every president has...

latest_numbers_LNS15000000_1975_2014_all_period_M09_data.gif
LOL! Wow that graph just demonstrates it all. Chiefly it demonstrates you are a dimbuilb.
It demonstrates what was said here, which is clearly too complex for your limited comprehension ... that every president had more people who were not in the labor force than any previous president going as far back as the data allows.
It actually doesn't demonstrate that. Nor is the assertion true.
latest_numbers_LNS11300000_1970_2014_all_period_M09_data.gif
Here's a graph of the workforce participation rate. Note that it goes up from 1970 to about 1990, then starts to decline. After 2008 it declines more severely.
People entered the labor force because they perceived job opportunities. They left for pretty much the opposite reason. Under Obama there is hardly any incentive to work at all.
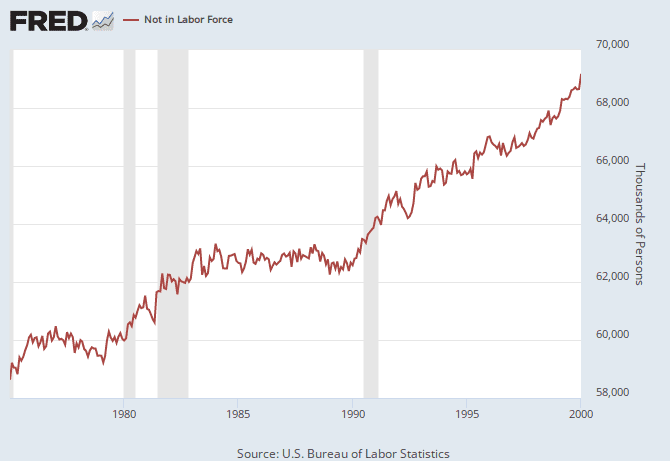
Are you not understanding the difference between level and rate? Faun's graph shows a steady increase in the number of people not in the labor force...a "new record" for every President.

Your graph shows the Labor Force Participation RATE: the percent of the population in the labor force. It has been going down since 2000.

In short: As the population grew from 1948 to 2000, both those in the labor force and those not in the labor force increased, but in the labor force increased faster, causing the participation rate to increase.

Since 2000, the number Not in the Labor Force has increased faster than those in the Labor Force (especially considering the drop in the labor force level due to the recession) and so the participation rate has dropped.
I dont know what his graph shows. It doesnt appear to show anything as there is no context whatsoever.
Assuming you are correct, so what? The key fact is more people are opting out of working. That is likely due to a bad economy failing to attract people into the job force. It is likely because following every other recession the UE rate blipped up as people previously not looking for work suddenly entered the workforce. Tht didnt happen this time and the reason is poor prospecs. Because this is the worst administration in history for the economy and its policies are complete failures.

Ok, let's try a different version that's better marked:
fredgraph.png


So this is the level of those Not in the Labor Force, which is defined as everyone 16 and older who is not in the military, prison, or an institution who is neither working nor looking for work (not employed or unemployed). These are mostly retirees, disabled, students not working, and stay home spouses...over 90% of those not in the labor force don't want a job.

The significance is that there was some fuss made about Obama having a record number of people not in the labor force, but as is shown in the graph, that number has been going up anyway.
 
:lmao::lmao::lmao::lmao::lmao:

Pretending you didn't make a fool of yourself, Jester, doesn't help you.

:lmao::lmao::lmao::lmao::lmao:
I dont need to pretend. I just need to point out your chart is worthless and you can't explain it.
Ok, so you weren't pretending.

Meanwhile, you remain the only one here who doesn't understand it. Even after 2 explanations, you still don't get it. Clearly, you don't possess even the minimum mental faculties required to understand it. That's ok, Jester, I doubt anyone here (except you, of course) thought you did.
Nope, still no understanding of what "demonstrate" means.
You might want to try a dictionary or something. Meanwhile your chart remains floating like a turd in the toiletbowl.
cries the forum jester who admits he doesn't understand the chart.
Says thea ssclown who can't explain it.

You can't explain it because the chart doesnt make sense.
Imbecile ... I already explained it. Others got it even though you're not capable. Clearly, the problem is your limited mental capabilities and not my ability to explain it. :eusa_doh:
 
(thousands]

The number of non-participants in the workforce since 1975 (raw numbers). Indeed, the graph DOES show that, in raw numbers, the number of non-participants in the WF has peaked in every administration as Faun and pingy have shown!

latest_numbers_LNS15000000_1975_2014_all_period_M09_data.gif


latest_numbers_LNS11300000_1970_2014_all_period_M09_data.gif


The bottom graph shows the workforce participation RATE since 1970. The workforce population has increased 50% since 1978 from about 100,000,000t then to 150,000,000 now! Just threw that in there for kicks!
 
:lmao::lmao::lmao::lmao::lmao:

Pretending you didn't make a fool of yourself, Jester, doesn't help you.

:lmao::lmao::lmao::lmao::lmao:
I dont need to pretend. I just need to point out your chart is worthless and you can't explain it.
Ok, so you weren't pretending.

Meanwhile, you remain the only one here who doesn't understand it. Even after 2 explanations, you still don't get it. Clearly, you don't possess even the minimum mental faculties required to understand it. That's ok, Jester, I doubt anyone here (except you, of course) thought you did.
Nope, still no understanding of what "demonstrate" means.
You might want to try a dictionary or something. Meanwhile your chart remains floating like a turd in the toiletbowl.
cries the forum jester who admits he doesn't understand the chart.
Says thea ssclown who can't explain it.

You can't explain it because the chart doesnt make sense.

Both Faun and pingy's charts are crystal clear to us heterosexuals lurking about. Your mind is clouded by homosexual fantasies and your peculiar predilection.
 
As the chart, which the forum jester can't understand, shows. :mm:
Chart shows nothing. The only thing is shows is you can't read a chart.
:banana::asshole:
Stop projecting, Jester:laugh2: It's already been demonstrated that you're the only one who can't read it. :eek: No one else had a problem. Go figure. :dunno:
That has been demonstrated about as much as what the chart is about.
Which is to say nothing at all.
I think you don't understand what the word "demonstrate" means.
:lmao::lmao::lmao::lmao::lmao:

Pretending you didn't make a fool of yourself, Jester, doesn't help you.

:lmao::lmao::lmao::lmao::lmao:
I dont need to pretend. I just need to point out your chart is worthless and you can't explain it.


Do you have kids? If so, ask one of them to explain it to you...
 
Chart shows nothing. The only thing is shows is you can't read a chart.
:banana::asshole:
Stop projecting, Jester:laugh2: It's already been demonstrated that you're the only one who can't read it. :eek: No one else had a problem. Go figure. :dunno:
That has been demonstrated about as much as what the chart is about.
Which is to say nothing at all.
I think you don't understand what the word "demonstrate" means.
:lmao::lmao::lmao::lmao::lmao:

Pretending you didn't make a fool of yourself, Jester, doesn't help you.

:lmao::lmao::lmao::lmao::lmao:
I dont need to pretend. I just need to point out your chart is worthless and you can't explain it.


Do you have kids? If so, ask one of them to explain it to you...
The world can only hope he hasn't bred. Can you imagine the dumb fucking retards that would spawn from a brain-dead miserable curmudgeon like :laugh2:Jester:laugh2:? I'd have to pity such blobs. :eek:
 
I dont need to pretend. I just need to point out your chart is worthless and you can't explain it.
Ok, so you weren't pretending.

Meanwhile, you remain the only one here who doesn't understand it. Even after 2 explanations, you still don't get it. Clearly, you don't possess even the minimum mental faculties required to understand it. That's ok, Jester, I doubt anyone here (except you, of course) thought you did.
Nope, still no understanding of what "demonstrate" means.
You might want to try a dictionary or something. Meanwhile your chart remains floating like a turd in the toiletbowl.
cries the forum jester who admits he doesn't understand the chart.
Says thea ssclown who can't explain it.

You can't explain it because the chart doesnt make sense.

Both Faun and pingy's charts are crystal clear to us heterosexuals lurking about. Your mind is clouded by homosexual fantasies and your peculiar predilection.
Then why don't you go ahead and explain his chart. We'll wait.

explain ?
ok, you're a dumbass.
Translation: I can't explain it either so I'll call names.
 
Ok, so you weren't pretending.

Meanwhile, you remain the only one here who doesn't understand it. Even after 2 explanations, you still don't get it. Clearly, you don't possess even the minimum mental faculties required to understand it. That's ok, Jester, I doubt anyone here (except you, of course) thought you did.
Nope, still no understanding of what "demonstrate" means.
You might want to try a dictionary or something. Meanwhile your chart remains floating like a turd in the toiletbowl.
cries the forum jester who admits he doesn't understand the chart.
Says thea ssclown who can't explain it.

You can't explain it because the chart doesnt make sense.

Both Faun and pingy's charts are crystal clear to us heterosexuals lurking about. Your mind is clouded by homosexual fantasies and your peculiar predilection.
Then why don't you go ahead and explain his chart. We'll wait.
You didn't read post #412? I explained it there. Get Limbaugh's balls out of your eyes and take a peek!
 
cries the forum jester who admits he doesn't understand the chart.
Says thea ssclown who can't explain it.

You can't explain it because the chart doesnt make sense.

Both Faun and pingy's charts are crystal clear to us heterosexuals lurking about. Your mind is clouded by homosexual fantasies and your peculiar predilection.
Then why don't you go ahead and explain his chart. We'll wait.

explain ?
ok, you're a dumbass.
Translation: I can't explain it either so I'll call names.
I've explained it twice. What part did you not understand?
 

Forum List

Back
Top