Navigation
Install the app
How to install the app on iOS
Follow along with the video below to see how to install our site as a web app on your home screen.

Note: This feature currently requires accessing the site using the built-in Safari browser.
More options
You are using an out of date browser. It may not display this or other websites correctly.
You should upgrade or use an alternative browser.
You should upgrade or use an alternative browser.
Trenberth Debunks Himself
- Thread starter SSDD
- Start date
SSDD
Gold Member
- Nov 6, 2012
- 16,672
- 1,966
- 280
- Thread starter
- #182
You make less sense with every post....I don't think I have ever mentioned magic except for your belief in magic properties of CO2. Feel free to prove me wrong by posting any such claim of magic by me and at the same time, prove that you can actually get something, no matter how inconsequential, right.You guys should have a meeting and exchange secret handshakes.
Like you guys......no thanks.
Glad to see you recognize yourself in passing reference. I wasn't sure I was remembering correctly who it was that had argued magic. Thanks for the confirmation.
- Banned
- #183
I've got an idea. Why don't we return to the thread's actual topic.
Here is the abstract of the Trenberth paper wherein SSDD claims the man "debunked himself". I don't actually see it. Could one of you kind souls point it out for me?
Abstract
Climate change from increased greenhouse gases arises from a global energy imbalance at the
top-of-atmosphere (TOA). TOA measurements of radiation from space can track changes over
time but lack absolute accuracy.An inventory of energy storage changes shows that over 90%
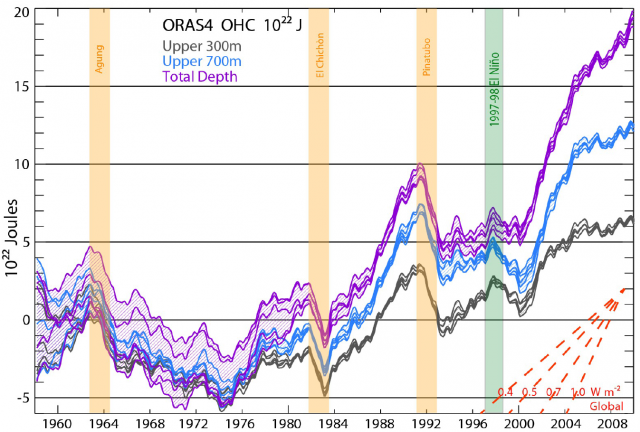
of the imbalance is manifested as a rise in ocean heat content(OHC). We use ORAS4 ocean
reanalysis data and other OHC estimated rates of change to compare with model-based
estimates of TOA energy imbalance (from CCSM4), and with TOA satellite measurements for
the year 2000 onwards. Most ocean-only OHC analyses extend to only 700m depth, have large
discrepancies among the rates of change of OHC, and do not resolve interannual variability
adequately to capture ENSO and volcanic eruption effects, all aspects that are improved with
assimilation of multi-variate data. ORAS4 rates-of-change of OHC quantitatively agree with the
radiative forcing estimates of impacts of the 3 major volcanic eruptions since 1960 (Mt.Agung
1963, El Chichón1982, and Mt.Pinatubo 1991). The natural variability of the energy imbalance
is substantial from month-to-month associated with cloud and weather variations, and
interannually mainly associated with ENSO, while the Sun affects 15% of the climate change
signal on decadal timescales. All estimates (OHC and TOA) show that over the past decade the
energy imbalance ranges between about 0.5 and 1 Wm-2. By using the full-depth ocean, there
is a better overall accounting for energy, but discrepancies remain at interannual timescales
between OHC and TOA-based estimates, notably in 2008-09.
Here is the abstract of the Trenberth paper wherein SSDD claims the man "debunked himself". I don't actually see it. Could one of you kind souls point it out for me?
Abstract
Climate change from increased greenhouse gases arises from a global energy imbalance at the
top-of-atmosphere (TOA). TOA measurements of radiation from space can track changes over
time but lack absolute accuracy.An inventory of energy storage changes shows that over 90%
of the imbalance is manifested as a rise in ocean heat content(OHC). We use ORAS4 ocean
reanalysis data and other OHC estimated rates of change to compare with model-based
estimates of TOA energy imbalance (from CCSM4), and with TOA satellite measurements for
the year 2000 onwards. Most ocean-only OHC analyses extend to only 700m depth, have large
discrepancies among the rates of change of OHC, and do not resolve interannual variability
adequately to capture ENSO and volcanic eruption effects, all aspects that are improved with
assimilation of multi-variate data. ORAS4 rates-of-change of OHC quantitatively agree with the
radiative forcing estimates of impacts of the 3 major volcanic eruptions since 1960 (Mt.Agung
1963, El Chichón1982, and Mt.Pinatubo 1991). The natural variability of the energy imbalance
is substantial from month-to-month associated with cloud and weather variations, and
interannually mainly associated with ENSO, while the Sun affects 15% of the climate change
signal on decadal timescales. All estimates (OHC and TOA) show that over the past decade the
energy imbalance ranges between about 0.5 and 1 Wm-2. By using the full-depth ocean, there
is a better overall accounting for energy, but discrepancies remain at interannual timescales
between OHC and TOA-based estimates, notably in 2008-09.
Last edited:
- Banned
- #184
You make less sense with every post....I don't think I have ever mentioned magic except for your belief in magic properties of CO2. Feel free to prove me wrong by posting any such claim of magic by me and at the same time, prove that you can actually get something, no matter how inconsequential, right.Like you guys......no thanks.
Glad to see you recognize yourself in passing reference. I wasn't sure I was remembering correctly who it was that had argued magic. Thanks for the confirmation.
No thanks Merlin.
I've got an idea. Why don't we return to the thread's actual topic.
Here is the abstract of the Trenberth paper wherein SSDD claims the man "debunked himself". I don't actually see it. Could one of you kind souls point it out for me?
Abstract
Climate change from increased greenhouse gases arises from a global energy imbalance at the
top-of-atmosphere (TOA). TOA measurements of radiation from space can track changes over
time but lack absolute accuracy.An inventory of energy storage changes shows that over 90%
of the imbalance is manifested as a rise in ocean heat content(OHC). We use ORAS4 ocean
reanalysis data and other OHC estimated rates of change to compare with model-based
estimates of TOA energy imbalance (from CCSM4), and with TOA satellite measurements for
the year 2000 onwards. Most ocean-only OHC analyses extend to only 700m depth, have large
discrepancies among the rates of change of OHC, and do not resolve interannual variability
adequately to capture ENSO and volcanic eruption effects, all aspects that are improved with
assimilation of multi-variate data. ORAS4 rates-of-change of OHC quantitatively agree with the
radiative forcing estimates of impacts of the 3 major volcanic eruptions since 1960 (Mt.Agung
1963, El Chichón1982, and Mt.Pinatubo 1991). The natural variability of the energy imbalance
is substantial from month-to-month associated with cloud and weather variations, and
interannually mainly associated with ENSO, while the Sun affects 15% of the climate change
signal on decadal timescales. All estimates (OHC and TOA) show that over the past decade the
energy imbalance ranges between about 0.5 and 1 Wm-2. By using the full-depth ocean, there
is a better overall accounting for energy, but discrepancies remain at interannual timescales
between OHC and TOA-based estimates, notably in 2008-09.
Sure. I've just scanned the paper. It's on my list of stuff to read.. But the basic idea is that graph that shows in OP reports that the forcing function (the RATE of heating) does not agree with the original BTK concept of a constantly increasing Deep Ocean Heating. It shows instead that RATE of warming is actually much more sporadic and has indeed DECLINED in the past decade.
This is OK -- since Dr Kevin T is just realizing that the Deep Oceans probably don't respond IMMEDIATELY to forcings. He's learning a bit slowly here -- but will eventually understand more about the importance of DELAYS, and outputs that don't convieniently curve fit to the forcings. That is -- when he actually starts doing CLIMATE SCIENCE and puts emphasis on understanding the details of how heat forcings and distributions affect the climate.
One problem with the ORIGINAL BTK work is that the shape of the "hidden heat" doesn't imply an INCREASINGLY larger forcing function. And NOW --- we know that fact (that old FlaCalTenn tried to point out to y'all) is very problematic and admitted by the authors.
Another problem is, (and SSDD will love me to mention this) is that the DownRadiation from the GHouse CAN'T warm the oceans by itself. Because it has a NET UPWARDS radiation flux. So the SOURCE of the warming is more likely to be solar radiation imbalanced by the decreased COOLING due to GHGas buildup. (That and the fact that LW IR is NOWHERE NEAR as efficient at heating water as wideband solar irradiation).
- Banned
- #186
What an ego you've got. People who actually are in his league wouldn't talk to him like that. You sound like an adolescent with hormone issues.
I'm quite certain Kevin Trenberth has forgotten more about delays and complex forcing functions than you've ever known.
If you want to suggest that the OHC curve from BTK 2013 was actually significantly delayed, you're going to have to explain the appearance of the last three major volcanic eruptions.
Last edited:
What an ego you've got. People who actually are in his league wouldn't talk to him like that. You sound like an adolescent with hormone issues.
I'm quite certain Kevin Trenberth has forgotten more about delays and complex forcing functions than you've ever known.
If you want to suggest that the OHC curve from BTK 2013 was actually significantly delayed, you're going to have to explain the appearance of the last three major volcanic eruptions.
Funny how you confuse knowledge with ego. As a matter of fact, the folks at NOAA HAVE talked to him.. Since NOAA used DATA to acheive their OHC studies, and Trenberth used re-analysis modeling to get his. The re-analysis sprinkled in MANY variables including the SOD (stratosphere optical density) from volcanic activity..
Thus -- here's the diff btwn NOAA DATA only and a model/data approach..


Tho in GENERAL agreement, those well-timed and obvious "volcanic effects" are not really apparent in the NOAA data.
I also have read a couple papers describing HOW and WHY the GCModels and ocean re-analysis stuff do not reliably portray the volcanic effects on OHeatContent.
Trenberth lost my confidence when he published his first "Energy Budget" blockbuster using units that didn't represent energy and showed no storage of energy in his well-tuned finding of the radiative imbalance (about 1.5W/m2) out of HUNDREDS of W/m2 averaged over the globe and averaged over time. He has a history of CONVIENIENTLY finding VERY VERY small numbers that serendipitously match what he's looking for..
And the folks at NOAA are no more impressed with his explanation of how the heat got there --- then I am..
NOW -- with the paper in THIS OP --- he's beginning to "get it".. He's actually stating that the forcing functions do not match the apparent "hidden heat" in light of increased GHGas radiative forcing.. Pretty soon, he'll be doing actual climate science -- I swear.. He just got sidetracked for a couple decades finding those hidden very small numbers out of data that never had the fidelity and confidence to PRODUCE those small numbers..
What an ego you've got. People who actually are in his league wouldn't talk to him like that. You sound like an adolescent with hormone issues.
I'm quite certain Kevin Trenberth has forgotten more about delays and complex forcing functions than you've ever known.
If you want to suggest that the OHC curve from BTK 2013 was actually significantly delayed, you're going to have to explain the appearance of the last three major volcanic eruptions.
Funny how you confuse knowledge with ego. As a matter of fact, the folks at NOAA HAVE talked to him.. Since NOAA used DATA to acheive their OHC studies, and Trenberth used re-analysis modeling to get his. The re-analysis sprinkled in MANY variables including the SOD (stratosphere optical density) from volcanic activity..
Thus -- here's the diff btwn NOAA DATA only and a model/data approach..
Tho in GENERAL agreement, those well-timed and obvious "volcanic effects" are not really apparent in the NOAA data.
I also have read a couple papers describing HOW and WHY the GCModels and ocean re-analysis stuff do not reliably portray the volcanic effects on OHeatContent.
Trenberth lost my confidence when he published his first "Energy Budget" blockbuster using units that didn't represent energy and showed no storage of energy in his well-tuned finding of the radiative imbalance (about 1.5W/m2) out of HUNDREDS of W/m2 averaged over the globe and averaged over time. He has a history of CONVIENIENTLY finding VERY VERY small numbers that serendipitously match what he's looking for..
And the folks at NOAA are no more impressed with his explanation of how the heat got there --- then I am..
NOW -- with the paper in THIS OP --- he's beginning to "get it".. He's actually stating that the forcing functions do not match the apparent "hidden heat" in light of increased GHGas radiative forcing.. Pretty soon, he'll be doing actual climate science -- I swear.. He just got sidetracked for a couple decades finding those hidden very small numbers out of data that never had the fidelity and confidence to PRODUCE those small numbers..
yup, general agreement. convenient agreement. pinatubo doesnt quite fit though does it?
wasnt there an ocean heat paper recently that supported the current fast rise....but showed that OHC was dramatically higher in past centuries? which is the more important factoid?
There were couple mudbug proxy studies discussed in forum for mid-level ocean floors. They did find CONSIDERABLY warmer waters Less than 1500 yrs ago.. But of course the Headline in the press release touted "the unprecendented rate of warming" , which of course mudbug studies are notoriously bad at determining.. (Authors claimed better time resolution. Probably improved from 1000 yrs to 400 years).
- Banned
- #192
What an ego you've got. People who actually are in his league wouldn't talk to him like that. You sound like an adolescent with hormone issues.
I'm quite certain Kevin Trenberth has forgotten more about delays and complex forcing functions than you've ever known.
If you want to suggest that the OHC curve from BTK 2013 was actually significantly delayed, you're going to have to explain the appearance of the last three major volcanic eruptions.
Funny how you confuse knowledge with ego. As a matter of fact, the folks at NOAA HAVE talked to him.. Since NOAA used DATA to acheive their OHC studies, and Trenberth used re-analysis modeling to get his. The re-analysis sprinkled in MANY variables including the SOD (stratosphere optical density) from volcanic activity..
Thus -- here's the diff btwn NOAA DATA only and a model/data approach..
Tho in GENERAL agreement, those well-timed and obvious "volcanic effects" are not really apparent in the NOAA data.
I also have read a couple papers describing HOW and WHY the GCModels and ocean re-analysis stuff do not reliably portray the volcanic effects on OHeatContent.
Trenberth lost my confidence when he published his first "Energy Budget" blockbuster using units that didn't represent energy and showed no storage of energy in his well-tuned finding of the radiative imbalance (about 1.5W/m2) out of HUNDREDS of W/m2 averaged over the globe and averaged over time. He has a history of CONVIENIENTLY finding VERY VERY small numbers that serendipitously match what he's looking for..
And the folks at NOAA are no more impressed with his explanation of how the heat got there --- then I am..
NOW -- with the paper in THIS OP --- he's beginning to "get it".. He's actually stating that the forcing functions do not match the apparent "hidden heat" in light of increased GHGas radiative forcing.. Pretty soon, he'll be doing actual climate science -- I swear.. He just got sidetracked for a couple decades finding those hidden very small numbers out of data that never had the fidelity and confidence to PRODUCE those small numbers..
BTK's model run was stopped every ten days and reset to MEASURED PARAMETERS.
All three of those plots match very closely. Where do you see any large discrepancy between them?
Yes, they had to stop them every ten days otherwise the graph would have been astoundingly stupid. That's the problem with piss poor GCM's....they are nowhere near reality.
BTK's model run was stopped every ten days and reset to MEASURED PARAMETERS.
All three of those plots match very closely. Where do you see any large discrepancy between them?
I brought up the NOAA data because you were fixated on the "signature" of those volcanic activities. And I knew that many papers popped up 2013 warning that GCMs and theory placed too much emphasis on volcanic influence for OHContent. So OBVIOUSLY, one diff is that there are NO undisputable volcanic signals in the NOAA charts..
I'm not certain that the models were actually "reset" every 10 days. I'm sure they were weighted "back on track" using the real data. Models of ocean heat distribution that are only good to 10 day spreads without restarts dont give high confidence that they are predicting the heat spreads. The widespread availability of data with ORAS4 probably gives a better reading for actual GLOBALLY AVERAGED OHC measurements. And my guess is that is we will NOW see OHC measurements with much more variability than shows for the pre-1980s data.
It would be much more convincing if before we go out and model the crap out of an entire GLOBAL AVERAGE --- that some number of studies would concentrate on known ocean conveyors (like the Gulf Stream) and show adequate results for those regional areas of the ocean.. Again the insistence on this silly Global averages is ruining the focus of actually tuning models to how the climate system works REGIONALLY..
- Banned
- #195
Funny how you confuse knowledge with ego. As a matter of fact, the folks at NOAA HAVE talked to him.. Since NOAA used DATA to acheive their OHC studies, and Trenberth used re-analysis modeling to get his. The re-analysis sprinkled in MANY variables including the SOD (stratosphere optical density) from volcanic activity..
Thus -- here's the diff btwn NOAA DATA only and a model/data approach..
Tho in GENERAL agreement, those well-timed and obvious "volcanic effects" are not really apparent in the NOAA data.
I also have read a couple papers describing HOW and WHY the GCModels and ocean re-analysis stuff do not reliably portray the volcanic effects on OHeatContent.
Trenberth lost my confidence when he published his first "Energy Budget" blockbuster using units that didn't represent energy and showed no storage of energy in his well-tuned finding of the radiative imbalance (about 1.5W/m2) out of HUNDREDS of W/m2 averaged over the globe and averaged over time. He has a history of CONVIENIENTLY finding VERY VERY small numbers that serendipitously match what he's looking for..
And the folks at NOAA are no more impressed with his explanation of how the heat got there --- then I am..
NOW -- with the paper in THIS OP --- he's beginning to "get it".. He's actually stating that the forcing functions do not match the apparent "hidden heat" in light of increased GHGas radiative forcing.. Pretty soon, he'll be doing actual climate science -- I swear.. He just got sidetracked for a couple decades finding those hidden very small numbers out of data that never had the fidelity and confidence to PRODUCE those small numbers..
BTK's model run was stopped every ten days and reset to MEASURED PARAMETERS.
All three of those plots match very closely. Where do you see any large discrepancy between them?
Yes, they had to stop them every ten days otherwise the graph would have been astoundingly stupid. That's the problem with piss poor GCM's....they are nowhere near reality.
Don't be stupid. That they reset them every ten days means they can be no more than 10 days away from the reality of the measurement. And for what it's worth, I can see at least three of BTK's four volcanoes in the NOAA data. And these comments about NOAA's opinions of BTKs work: how about some quotes supporting that accusation? Got any?
ScienceRocks
Democrat all the way!
- Banned
- #196
Abraham,
Let's say we're in 2017 and temperature is still controlled by the noise of the enso? How long will things have to be stalled before you question things.
Let's say we're in 2017 and temperature is still controlled by the noise of the enso? How long will things have to be stalled before you question things.
SSDD
Gold Member
- Nov 6, 2012
- 16,672
- 1,966
- 280
- Thread starter
- #197
Abraham,
Let's say we're in 2017 and temperature is still controlled by the noise of the enso? How long will things have to be stalled before you question things.
He will never question. Congratulations to you by the way for at least asking about some of the glaring problems in climate science
BTK's model run was stopped every ten days and reset to MEASURED PARAMETERS.
All three of those plots match very closely. Where do you see any large discrepancy between them?
Yes, they had to stop them every ten days otherwise the graph would have been astoundingly stupid. That's the problem with piss poor GCM's....they are nowhere near reality.
Don't be stupid. That they reset them every ten days means they can be no more than 10 days away from the reality of the measurement. And for what it's worth, I can see at least three of BTK's four volcanoes in the NOAA data. And these comments about NOAA's opinions of BTKs work: how about some quotes supporting that accusation? Got any?
 Wow, you need to take a class on computer modeling. If a model is written correctly it runs until the completion date is reached and you then compare results with physical observations. A ten day run is a joke.
Similar threads
- Replies
- 114
- Views
- 2K
- Replies
- 38
- Views
- 661
- Replies
- 117
- Views
- 2K
Latest Discussions
- Replies
- 127
- Views
- 469
- Replies
- 9
- Views
- 13
- Replies
- 111
- Views
- 545
- Replies
- 9
- Views
- 54
Forum List
-
-
-
-
-
Political Satire 8091
-
-
-
-
-
-
-
-
-
-
-
-
-
-
-
-
-
-
-
ObamaCare 781
-
-
-
-
-
-
-
-
-
-
-
Member Usernotes 471
-
-
-
-
-
-
-
-
-
-